
 Yahoo Finance
 Did You Miss OceanaGold's (TSE:OGC) 40% Share Price Gain?

Want to participate in a short research study? Help shape the future of investing tools and you could win a $250 gift card!
When we invest, we're generally looking for stocks that outperform the market average. And while active stock picking involves risks (and requires diversification) it can also provide excess returns. For example, the OceanaGold Corporation (TSE:OGC) share price is up 40% in the last 5 years, clearly besting than the market return of around 5.5% (ignoring dividends). However, more recent returns haven't been as impressive as that, with the stock returning just 14% in the last year, including dividends.
View our latest analysis for OceanaGold
While markets are a powerful pricing mechanism, share prices reflect investor sentiment, not just underlying business performance. One flawed but reasonable way to assess how sentiment around a company has changed is to compare the earnings per share (EPS) with the share price.
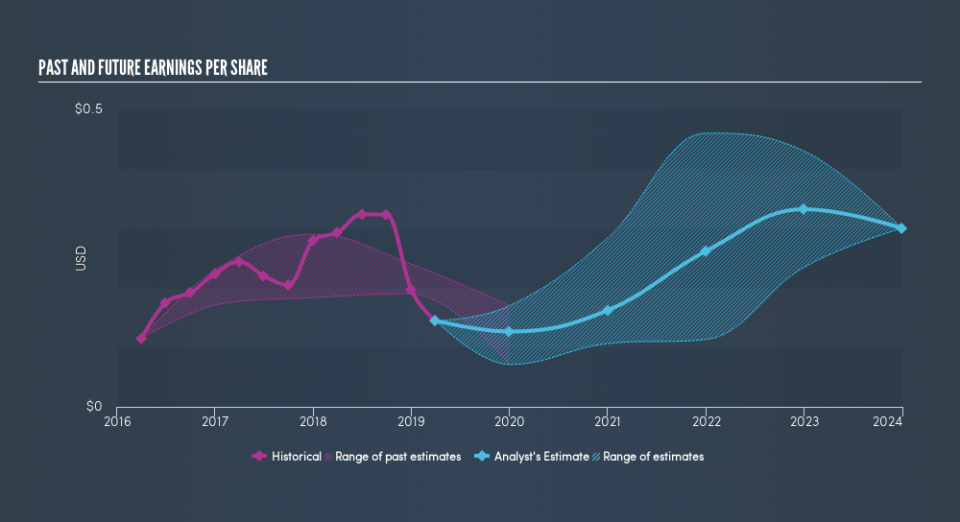
During five years of share price growth, OceanaGold achieved compound earnings per share (EPS) growth of 60% per year. This EPS growth is higher than the 6.9% average annual increase in the share price. Therefore, it seems the market has become relatively pessimistic about the company.
You can see how EPS has changed over time in the image below (click on the chart to see the exact values).
Dive deeper into OceanaGold's key metrics by checking this interactive graph of OceanaGold's earnings, revenue and cash flow.
What About Dividends?
It is important to consider the total shareholder return, as well as the share price return, for any given stock. The TSR incorporates the value of any spin-offs or discounted capital raisings, along with any dividends, based on the assumption that the dividends are reinvested. Arguably, the TSR gives a more comprehensive picture of the return generated by a stock. We note that for OceanaGold the TSR over the last 5 years was 48%, which is better than the share price return mentioned above. This is largely a result of its dividend payments!
A Different Perspective
It's good to see that OceanaGold has rewarded shareholders with a total shareholder return of 14% in the last twelve months. That's including the dividend. That gain is better than the annual TSR over five years, which is 8.1%. Therefore it seems like sentiment around the company has been positive lately. Given the share price momentum remains strong, it might be worth taking a closer look at the stock, lest you miss an opportunity. If you would like to research OceanaGold in more detail then you might want to take a look at whether insiders have been buying or selling shares in the company.
If you like to buy stocks alongside management, then you might just love this free list of companies. (Hint: insiders have been buying them).
Please note, the market returns quoted in this article reflect the market weighted average returns of stocks that currently trade on CA exchanges.
We aim to bring you long-term focused research analysis driven by fundamental data. Note that our analysis may not factor in the latest price-sensitive company announcements or qualitative material.
If you spot an error that warrants correction, please contact the editor at editorial-team@simplywallst.com. This article by Simply Wall St is general in nature. It does not constitute a recommendation to buy or sell any stock, and does not take account of your objectives, or your financial situation. Simply Wall St has no position in the stocks mentioned. Thank you for reading.
