
 Yahoo Finance
 Did At Home Group Inc’s (NYSE:HOME) Recent Earnings Growth Beat The Trend?

In this commentary, I will examine At Home Group Inc’s (NYSE:HOME) latest earnings update (28 April 2018) and compare these figures against its performance over the past couple of years, as well as how the rest of the specialty retail industry performed. As an investor, I find it beneficial to assess HOME’s trend over the short-to-medium term in order to gauge whether or not the company is able to meet its goals, and ultimately sustainably grow over time. View out our latest analysis for At Home Group
How Well Did HOME Perform?
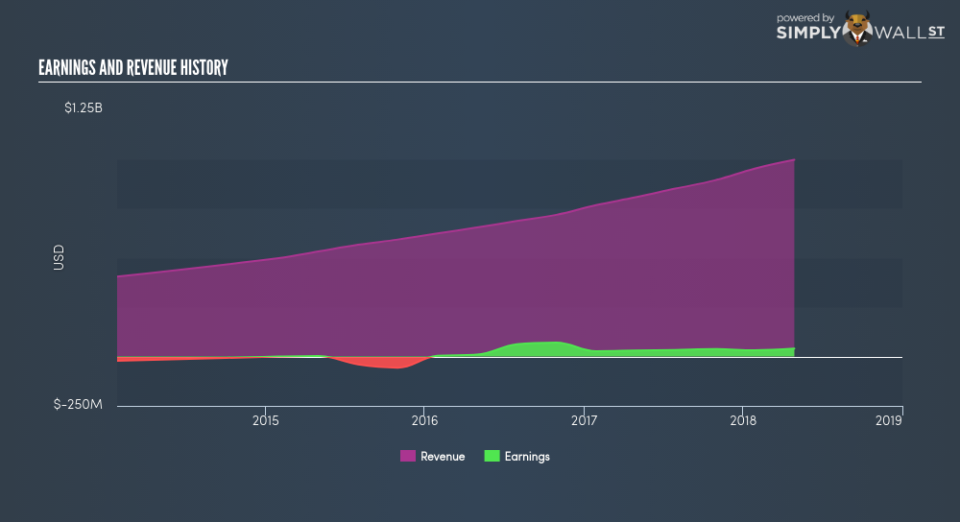
HOME’s trailing twelve-month earnings (from 28 April 2018) of US$40.12m has jumped 34.83% compared to the previous year. However, this one-year growth rate has been lower than its average earnings growth rate over the past 5 years of 61.44%, indicating the rate at which HOME is growing has slowed down. Why could this be happening? Well, let’s examine what’s transpiring with margins and if the rest of the industry is feeling the heat.
Over the last few years, revenue growth has failed to keep up which implies that At Home Group’s bottom line has been driven by unsustainable cost-cutting. Scanning growth from a sector-level, the US specialty retail industry has been growing, albeit, at a subdued single-digit rate of 6.67% over the previous twelve months, and 5.88% over the past half a decade. This means whatever uplift the industry is deriving benefit from, At Home Group is capable of leveraging this to its advantage.
In terms of returns from investment, At Home Group has not invested its equity funds well, leading to a 6.47% return on equity (ROE), below the sensible minimum of 20%. Furthermore, its return on assets (ROA) of 4.30% is below the US Specialty Retail industry of 7.16%, indicating At Home Group’s are utilized less efficiently. However, its return on capital (ROC), which also accounts for At Home Group’s debt level, has increased over the past 3 years from 0.77% to 7.32%.
What does this mean?
At Home Group’s track record can be a valuable insight into its earnings performance, but it certainly doesn’t tell the whole story. Positive growth and profitability are what investors like to see in a company’s track record, but how do we properly assess sustainability? I recommend you continue to research At Home Group to get a better picture of the stock by looking at:
Future Outlook: What are well-informed industry analysts predicting for HOME’s future growth? Take a look at our free research report of analyst consensus for HOME’s outlook.
Financial Health: Is HOME’s operations financially sustainable? Balance sheets can be hard to analyze, which is why we’ve done it for you. Check out our financial health checks here.
Other High-Performing Stocks: Are there other stocks that provide better prospects with proven track records? Explore our free list of these great stocks here.
NB: Figures in this article are calculated using data from the trailing twelve months from 28 April 2018. This may not be consistent with full year annual report figures.
To help readers see pass the short term volatility of the financial market, we aim to bring you a long-term focused research analysis purely driven by fundamental data. Note that our analysis does not factor in the latest price sensitive company announcements.
The author is an independent contributor and at the time of publication had no position in the stocks mentioned.
