
 Yahoo Finance
 Did GDI Integrated Facility Services Inc (TSE:GDI) Create Value For Investors Over The Past Year?

This article is intended for those of you who are at the beginning of your investing journey and want to begin learning the link between company’s fundamentals and stock market performance.
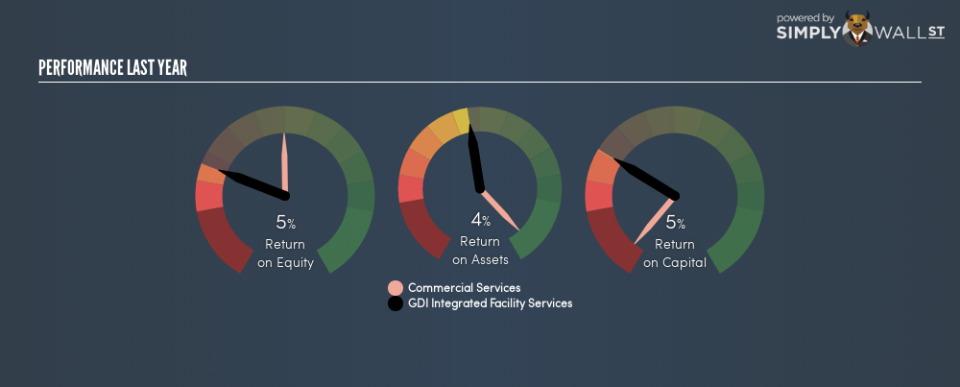
GDI Integrated Facility Services Inc’s (TSE:GDI) most recent return on equity was a substandard 5.0% relative to its industry performance of 15.9% over the past year. An investor may attribute an inferior ROE to a relatively inefficient performance, and whilst this can often be the case, knowing the nuts and bolts of the ROE calculation may change that perspective and give you a deeper insight into GDI’s past performance. Metrics such as financial leverage can impact the level of ROE which in turn can affect the sustainability of GDI’s returns. Let me show you what I mean by this.
Check out our latest analysis for GDI Integrated Facility Services
Breaking down Return on Equity
Firstly, Return on Equity, or ROE, is simply the percentage of last years’ earning against the book value of shareholders’ equity. For example, if the company invests CA$1 in the form of equity, it will generate CA$0.050 in earnings from this. Generally speaking, a higher ROE is preferred; however, there are other factors we must also consider before making any conclusions.
Return on Equity = Net Profit ÷ Shareholders Equity
ROE is assessed against cost of equity, which is measured using the Capital Asset Pricing Model (CAPM) – but let’s not dive into the details of that today. For now, let’s just look at the cost of equity number for GDI Integrated Facility Services, which is 10.1%. Given a discrepancy of -5.1% between return and cost, this indicated that GDI Integrated Facility Services may be paying more for its capital than what it’s generating in return. ROE can be broken down into three different ratios: net profit margin, asset turnover, and financial leverage. This is called the Dupont Formula:
Dupont Formula
ROE = profit margin × asset turnover × financial leverage
ROE = (annual net profit ÷ sales) × (sales ÷ assets) × (assets ÷ shareholders’ equity)
ROE = annual net profit ÷ shareholders’ equity
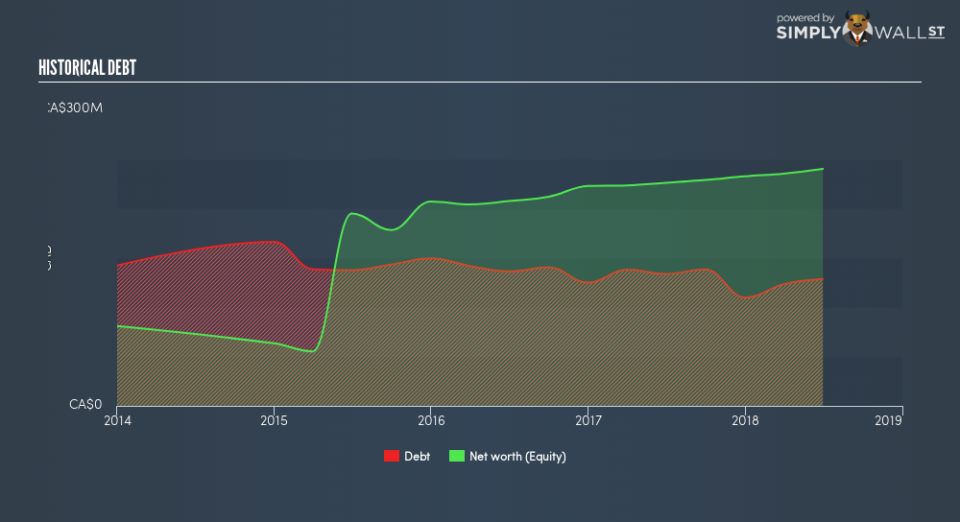
Essentially, profit margin shows how much money the company makes after paying for all its expenses. Asset turnover reveals how much revenue can be generated from GDI Integrated Facility Services’s asset base. And finally, financial leverage is simply how much of assets are funded by equity, which exhibits how sustainable the company’s capital structure is. Since ROE can be inflated by excessive debt, we need to examine GDI Integrated Facility Services’s debt-to-equity level. At 53.5%, GDI Integrated Facility Services’s debt-to-equity ratio appears sensible and indicates its ROE is generated from its capacity to increase profit without a large debt burden.
Next Steps:
ROE is one of many ratios which meaningfully dissects financial statements, which illustrates the quality of a company. GDI Integrated Facility Services exhibits a weak ROE against its peers, as well as insufficient levels to cover its own cost of equity this year. Although, its appropriate level of leverage means investors can be more confident in the sustainability of GDI Integrated Facility Services’s return with a possible increase should the company decide to increase its debt levels. Although ROE can be a useful metric, it is only a small part of diligent research.
For GDI Integrated Facility Services, I’ve compiled three essential aspects you should look at:
Financial Health: Does it have a healthy balance sheet? Take a look at our free balance sheet analysis with six simple checks on key factors like leverage and risk.
Valuation: What is GDI Integrated Facility Services worth today? Is the stock undervalued, even when its growth outlook is factored into its intrinsic value? The intrinsic value infographic in our free research report helps visualize whether GDI Integrated Facility Services is currently mispriced by the market.
Other High-Growth Alternatives : Are there other high-growth stocks you could be holding instead of GDI Integrated Facility Services? Explore our interactive list of stocks with large growth potential to get an idea of what else is out there you may be missing!
To help readers see past the short term volatility of the financial market, we aim to bring you a long-term focused research analysis purely driven by fundamental data. Note that our analysis does not factor in the latest price-sensitive company announcements.
The author is an independent contributor and at the time of publication had no position in the stocks mentioned. For errors that warrant correction please contact the editor at editorial-team@simplywallst.com.
