
 Yahoo Finance
 Did Changing Sentiment Drive Yamana Gold's (TSE:YRI) Share Price Down By 35%?
While not a mind-blowing move, it is good to see that the Yamana Gold Inc. (TSE:YRI) share price has gained 25% in the last three months. But if you look at the last five years the returns have not been good. You would have done a lot better buying an index fund, since the stock has dropped 35% in that half decade.
Check out our latest analysis for Yamana Gold
Yamana Gold isn't a profitable company, so it is unlikely we'll see a strong correlation between its share price and its earnings per share (EPS). Arguably revenue is our next best option. Generally speaking, companies without profits are expected to grow revenue every year, and at a good clip. As you can imagine, fast revenue growth, when maintained, often leads to fast profit growth.
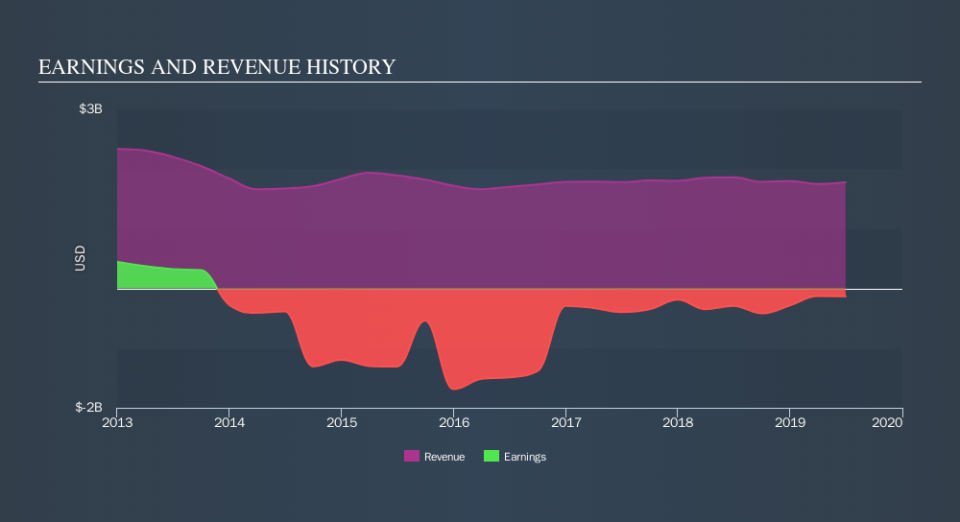
Over five years, Yamana Gold grew its revenue at 0.3% per year. That's not a very high growth rate considering it doesn't make profits. Given the weak growth, the share price fall of 8.3% isn't particularly surprising. Investors should consider how bad the losses are, and whether the company can make it to profitability with ease. Shareholders will want the company to approach profitability if it can't grow revenue any faster.
You can see how earnings and revenue have changed over time in the image below (click on the chart to see the exact values).
We consider it positive that insiders have made significant purchases in the last year. Having said that, most people consider earnings and revenue growth trends to be a more meaningful guide to the business. So we recommend checking out this free report showing consensus forecasts
What About Dividends?
It is important to consider the total shareholder return, as well as the share price return, for any given stock. Whereas the share price return only reflects the change in the share price, the TSR includes the value of dividends (assuming they were reinvested) and the benefit of any discounted capital raising or spin-off. It's fair to say that the TSR gives a more complete picture for stocks that pay a dividend. As it happens, Yamana Gold's TSR for the last 5 years was -31%, which exceeds the share price return mentioned earlier. This is largely a result of its dividend payments!
A Different Perspective
It's good to see that Yamana Gold has rewarded shareholders with a total shareholder return of 33% in the last twelve months. That's including the dividend. That certainly beats the loss of about 7.3% per year over the last half decade. This makes us a little wary, but the business might have turned around its fortunes. If you want to research this stock further, the data on insider buying is an obvious place to start. You can click here to see who has been buying shares - and the price they paid.
If you like to buy stocks alongside management, then you might just love this free list of companies. (Hint: insiders have been buying them).
Please note, the market returns quoted in this article reflect the market weighted average returns of stocks that currently trade on CA exchanges.
We aim to bring you long-term focused research analysis driven by fundamental data. Note that our analysis may not factor in the latest price-sensitive company announcements or qualitative material.
If you spot an error that warrants correction, please contact the editor at editorial-team@simplywallst.com. This article by Simply Wall St is general in nature. It does not constitute a recommendation to buy or sell any stock, and does not take account of your objectives, or your financial situation. Simply Wall St has no position in the stocks mentioned. Thank you for reading.
