
 Yahoo Finance
 Did Changing Sentiment Drive Telenet Group Holding's (EBR:TNET) Share Price Down By 41%?

Many investors define successful investing as beating the market average over the long term. But the risk of stock picking is that you will likely buy under-performing companies. We regret to report that long term Telenet Group Holding NV (EBR:TNET) shareholders have had that experience, with the share price dropping 41% in three years, versus a market return of about -27%. Even worse, it's down 24% in about a month, which isn't fun at all. We do note, however, that the broader market is down 23% in that period, and this may have weighed on the share price.
Check out our latest analysis for Telenet Group Holding
To quote Buffett, 'Ships will sail around the world but the Flat Earth Society will flourish. There will continue to be wide discrepancies between price and value in the marketplace...' By comparing earnings per share (EPS) and share price changes over time, we can get a feel for how investor attitudes to a company have morphed over time.
Although the share price is down over three years, Telenet Group Holding actually managed to grow EPS by 81% per year in that time. Given the share price reaction, one might suspect that EPS is not a good guide to the business performance during the period (perhaps due to a one-off loss or gain). Alternatively, growth expectations may have been unreasonable in the past.
Since the change in EPS doesn't seem to correlate with the change in share price, it's worth taking a look at other metrics.
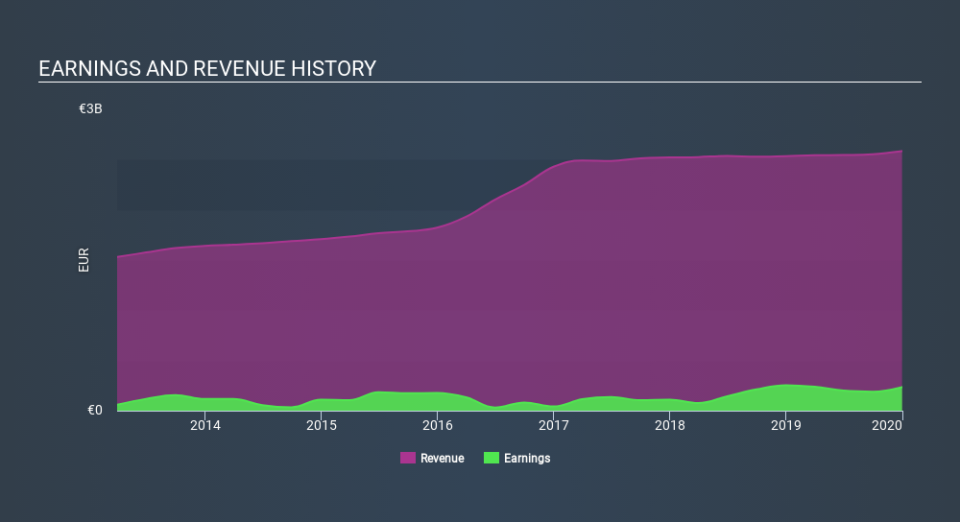
Given the healthiness of the dividend payments, we doubt that they've concerned the market. Revenue has been pretty flat over three years, so that isn't an obvious reason shareholders would sell. So it might be worth looking at how revenue growth over time, in greater detail.
You can see how earnings and revenue have changed over time in the image below (click on the chart to see the exact values).
Telenet Group Holding is well known by investors, and plenty of clever analysts have tried to predict the future profit levels. Given we have quite a good number of analyst forecasts, it might be well worth checking out this free chart depicting consensus estimates.
What About Dividends?
As well as measuring the share price return, investors should also consider the total shareholder return (TSR). Whereas the share price return only reflects the change in the share price, the TSR includes the value of dividends (assuming they were reinvested) and the benefit of any discounted capital raising or spin-off. So for companies that pay a generous dividend, the TSR is often a lot higher than the share price return. We note that for Telenet Group Holding the TSR over the last 3 years was -36%, which is better than the share price return mentioned above. The dividends paid by the company have thusly boosted the total shareholder return.
A Different Perspective
The total return of 20% received by Telenet Group Holding shareholders over the last year isn't far from the market return of -18%. So last year was actually even worse than the last five years, which cost shareholders 7.3% per year. It will probably take a substantial improvement in the fundamental performance for the company to reverse this trend. I find it very interesting to look at share price over the long term as a proxy for business performance. But to truly gain insight, we need to consider other information, too. To that end, you should learn about the 3 warning signs we've spotted with Telenet Group Holding (including 1 which is is a bit unpleasant) .
But note: Telenet Group Holding may not be the best stock to buy. So take a peek at this free list of interesting companies with past earnings growth (and further growth forecast).
Please note, the market returns quoted in this article reflect the market weighted average returns of stocks that currently trade on BE exchanges.
If you spot an error that warrants correction, please contact the editor at editorial-team@simplywallst.com. This article by Simply Wall St is general in nature. It does not constitute a recommendation to buy or sell any stock, and does not take account of your objectives, or your financial situation. Simply Wall St has no position in the stocks mentioned.
We aim to bring you long-term focused research analysis driven by fundamental data. Note that our analysis may not factor in the latest price-sensitive company announcements or qualitative material. Thank you for reading.
