
 Yahoo Finance
 Did Changing Sentiment Drive CBL & Associates Properties's (NYSE:CBL) Share Price Down A Painful 93%?

CBL & Associates Properties, Inc (NYSE:CBL) shareholders should be happy to see the share price up 22% in the last month. But will that repair the damage for the weary investors who have owned this stock as it declined over half a decade? Probably not. In fact, the share price has tumbled down a mountain to land 93% lower after that period. It's true that the recent bounce could signal the company is turning over a new leaf, but we are not so sure. The important question is if the business itself justifies a higher share price in the long term.
We really hope anyone holding through that price crash has a diversified portfolio. Even when you lose money, you don't have to lose the lesson.
See our latest analysis for CBL & Associates Properties
While the efficient markets hypothesis continues to be taught by some, it has been proven that markets are over-reactive dynamic systems, and investors are not always rational. By comparing earnings per share (EPS) and share price changes over time, we can get a feel for how investor attitudes to a company have morphed over time.
CBL & Associates Properties has made a profit in the past. On the other hand, it reported a trailing twelve months loss, suggesting it isn't reliably profitable. Other metrics may better explain the share price move.
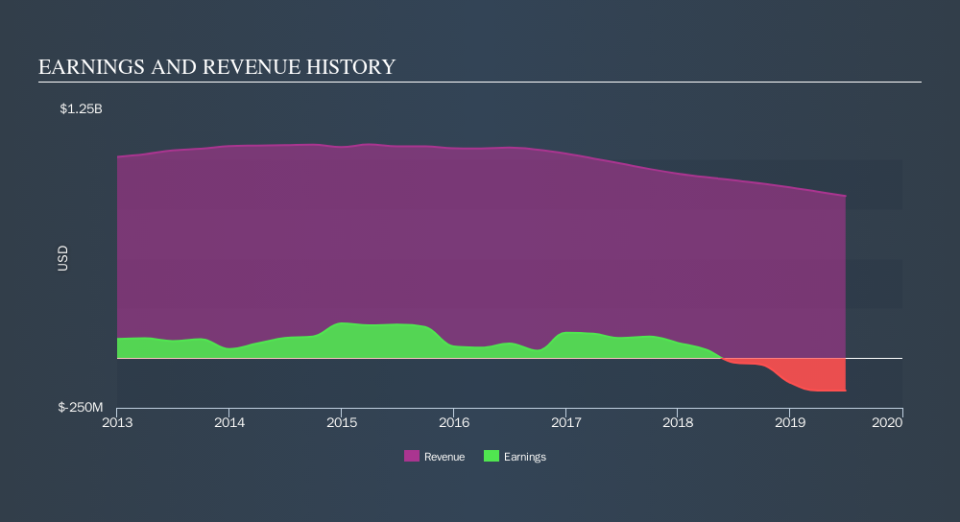
It could be that the revenue decline of 5.5% per year is viewed as evidence that CBL & Associates Properties is shrinking. That could explain the weak share price.
The image below shows how earnings and revenue have tracked over time (if you click on the image you can see greater detail).
If you are thinking of buying or selling CBL & Associates Properties stock, you should check out this FREE detailed report on its balance sheet.
What about the Total Shareholder Return (TSR)?
Investors should note that there's a difference between CBL & Associates Properties's total shareholder return (TSR) and its share price change, which we've covered above. The TSR is a return calculation that accounts for the value of cash dividends (assuming that any dividend received was reinvested) and the calculated value of any discounted capital raisings and spin-offs. Its history of dividend payouts mean that CBL & Associates Properties's TSR, which was a 88% drop over the last 5 years, was not as bad as the share price return.
A Different Perspective
CBL & Associates Properties shareholders are down 65% for the year, but the market itself is up 3.7%. However, keep in mind that even the best stocks will sometimes underperform the market over a twelve month period. Unfortunately, last year's performance may indicate unresolved challenges, given that it was worse than the annualised loss of 35% over the last half decade. We realise that Buffett has said investors should 'buy when there is blood on the streets', but we caution that investors should first be sure they are buying a high quality businesses. You could get a better understanding of CBL & Associates Properties's growth by checking out this more detailed historical graph of earnings, revenue and cash flow.
But note: CBL & Associates Properties may not be the best stock to buy. So take a peek at this free list of interesting companies with past earnings growth (and further growth forecast).
Please note, the market returns quoted in this article reflect the market weighted average returns of stocks that currently trade on US exchanges.
We aim to bring you long-term focused research analysis driven by fundamental data. Note that our analysis may not factor in the latest price-sensitive company announcements or qualitative material.
If you spot an error that warrants correction, please contact the editor at editorial-team@simplywallst.com. This article by Simply Wall St is general in nature. It does not constitute a recommendation to buy or sell any stock, and does not take account of your objectives, or your financial situation. Simply Wall St has no position in the stocks mentioned. Thank you for reading.
