
 Yahoo Finance
 Did Canada Rare Earth Corp’s (CVE:LL) Recent Earnings Growth Beat The Trend?

After reading Canada Rare Earth Corp’s (TSXV:LL) most recent earnings announcement (31 December 2017), I found it useful to look back at how the company has performed in the past and compare this against the latest numbers. As a long-term investor I tend to focus on earnings trend, rather than a single number at one point in time. Also, comparing it against an industry benchmark to understand whether it outperformed, or is simply riding an industry wave, is a crucial aspect. Below is a brief commentary on my key takeaways. See our latest analysis for Canada Rare Earth
Could LL beat the long-term trend and outperform its industry?
For the most up-to-date info, I use the ‘latest twelve-month’ data, which either annualizes the most recent 6-month earnings update, or in some cases, the most recent annual report is already the latest available financial data. This blend enables me to analyze various companies on a similar basis, using new information. For Canada Rare Earth, its latest earnings (trailing twelve month) is -CA$396.56K, which, against the previous year’s figure, has become less negative. Since these values are relatively short-term thinking, I have computed an annualized five-year figure for Canada Rare Earth’s earnings, which stands at -CA$2.25M. This means that, despite the fact that net income is negative, it has become less negative over the years.
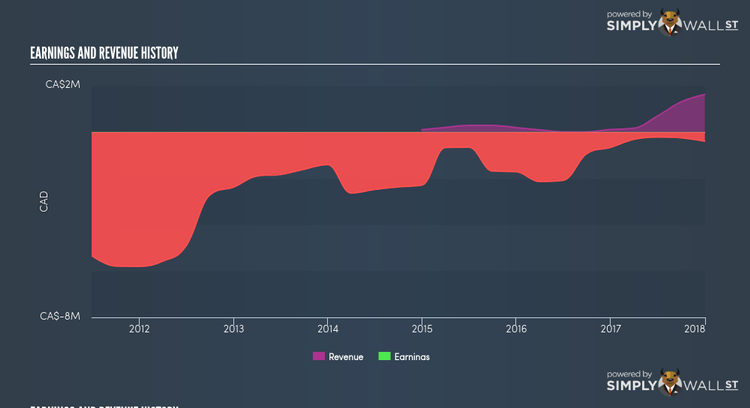
We can further analyze Canada Rare Earth’s loss by looking at what the industry has been experiencing over the past few years. Each year, for the past half a decade Canada Rare Earth’s top-line has grown by 89.03% on average, indicating that the company is in a high-growth phase with expenses shooting ahead of revenues, leading to annual losses. Viewing growth from a sector-level, the Canadian metals and mining industry has been growing its average earnings by double-digit 27.16% in the past year, and 12.51% over the last five years. This means while Canada Rare Earth is currently unprofitable, it may have gained from industry tailwinds, moving earnings towards to right direction.
What does this mean?
Canada Rare Earth’s track record can be a valuable insight into its earnings performance, but it certainly doesn’t tell the whole story. Companies that incur net loss is always difficult to forecast what will happen in the future and when. The most insightful step is to assess company-specific issues Canada Rare Earth may be facing and whether management guidance has regularly been met in the past. I suggest you continue to research Canada Rare Earth to get a better picture of the stock by looking at:
Financial Health: Is LL’s operations financially sustainable? Balance sheets can be hard to analyze, which is why we’ve done it for you. Check out our financial health checks here.
Other High-Performing Stocks: Are there other stocks that provide better prospects with proven track records? Explore our free list of these great stocks here.
NB: Figures in this article are calculated using data from the trailing twelve months from 31 December 2017. This may not be consistent with full year annual report figures.
To help readers see pass the short term volatility of the financial market, we aim to bring you a long-term focused research analysis purely driven by fundamental data. Note that our analysis does not factor in the latest price sensitive company announcements.
The author is an independent contributor and at the time of publication had no position in the stocks mentioned.
