
 Yahoo Finance
 Did Business Growth Power Andrew Peller’s (TSE:ADW.A) Share Price Gain of 191%?

When you buy shares in a company, it’s worth keeping in mind the possibility that it could fail, and you could lose your money. But on the bright side, you can make far more than 100% on a really good stock. Long term Andrew Peller Limited (TSE:ADW.A) shareholders would be well aware of this, since the stock is up 191% in five years. It’s also good to see the share price up 12% over the last quarter. But this move may well have been assisted by the reasonably buoyant market (up 12% in 90 days).
Check out our latest analysis for Andrew Peller
There is no denying that markets are sometimes efficient, but prices do not always reflect underlying business performance. One flawed but reasonable way to assess how sentiment around a company has changed is to compare the earnings per share (EPS) with the share price.
During five years of share price growth, Andrew Peller achieved compound earnings per share (EPS) growth of 7.5% per year. This EPS growth is slower than the share price growth of 24% per year, over the same period. This suggests that market participants hold the company in higher regard, these days. That’s not necessarily surprising considering the five-year track record of earnings growth.
You can see below how EPS has changed over time (discover the exact values by clicking on the image).
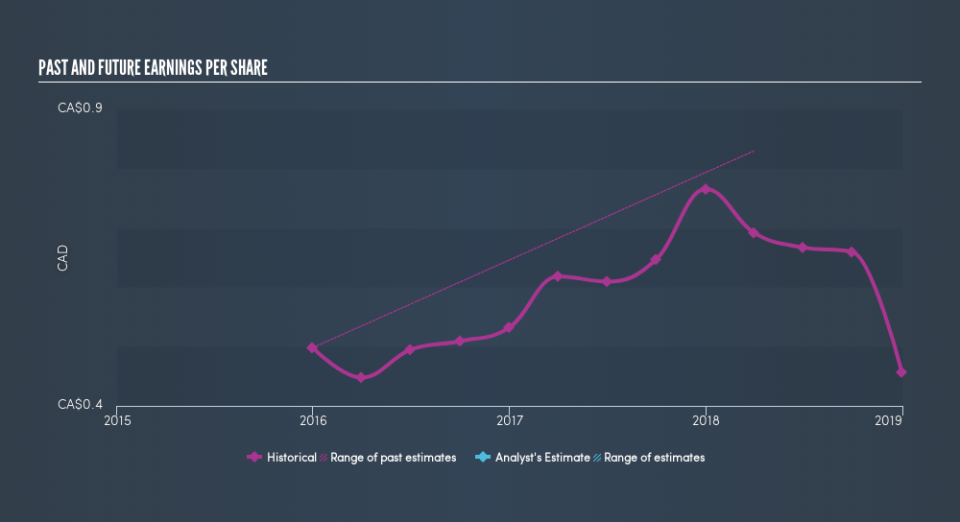
It might be well worthwhile taking a look at our free report on Andrew Peller’s earnings, revenue and cash flow.
What About Dividends?
When looking at investment returns, it is important to consider the difference between total shareholder return (TSR) and share price return. The TSR incorporates the value of any discounted capital raisings, along with any dividends, based on the assumption that the dividends are reinvested. It’s fair to say that the TSR gives a more complete picture for stocks that pay a dividend. We note that for Andrew Peller the TSR over the last 5 years was 221%, which is better than the share price return mentioned above. This is largely a result of its dividend payments!
A Different Perspective
Andrew Peller shareholders are down 28% for the year (even including dividends), but the market itself is up 3.3%. However, keep in mind that even the best stocks will sometimes underperform the market over a twelve month period. On the bright side, long term shareholders have made money, with a gain of 26% per year over half a decade. If the fundamental data continues to indicate long term sustainable growth, the current sell-off could be an opportunity worth considering. If you would like to research Andrew Peller in more detail then you might want to take a look at whether insiders have been buying or selling shares in the company.
For those who like to find winning investments this free list of growing companies with recent insider purchasing, could be just the ticket.
Please note, the market returns quoted in this article reflect the market weighted average returns of stocks that currently trade on CA exchanges.
We aim to bring you long-term focused research analysis driven by fundamental data. Note that our analysis may not factor in the latest price-sensitive company announcements or qualitative material.
If you spot an error that warrants correction, please contact the editor at editorial-team@simplywallst.com. This article by Simply Wall St is general in nature. It does not constitute a recommendation to buy or sell any stock, and does not take account of your objectives, or your financial situation. Simply Wall St has no position in the stocks mentioned. Thank you for reading.
