
 Yahoo Finance
 What Did Akebia Therapeutics, Inc.’s (NASDAQ:AKBA) CEO Take Home Last Year?

John Butler became the CEO of Akebia Therapeutics, Inc. (NASDAQ:AKBA) in 2013. This report will, first, examine the CEO compensation levels in comparison to CEO compensation at companies of similar size. Then we’ll look at a snap shot of the business growth. Third, we’ll reflect on the total return to shareholders over three years, as a second measure of business performance. The aim of all this is to consider the appropriateness of CEO pay levels.
View our latest analysis for Akebia Therapeutics
Want to help shape the future of investing tools and platforms? Take the survey and be part of one of the most advanced studies of stock market investors to date.
How Does John Butler’s Compensation Compare With Similar Sized Companies?
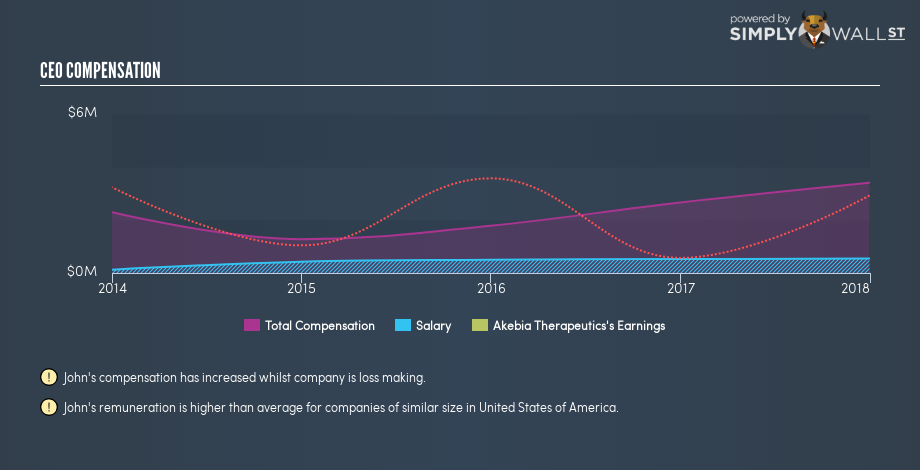
Our data indicates that Akebia Therapeutics, Inc. is worth US$701m, and total annual CEO compensation is US$3.4m. (This is based on the year to 2017). We think total compensation is more important but we note that the CEO salary is lower, at US$543k. We examined companies with market caps from US$400m to US$1.6b, and discovered that the median CEO compensation of that group was US$2.3m.
It would therefore appear that Akebia Therapeutics, Inc. pays John Butler more than the median CEO remuneration at companies of a similar size, in the same market. However, this fact alone doesn’t mean the remuneration is too high. A closer look at the performance of the underlying business will give us a better idea about whether the pay is particularly generous.
The graphic below shows how CEO compensation at Akebia Therapeutics has changed from year to year.
Is Akebia Therapeutics, Inc. Growing?
Akebia Therapeutics, Inc. has increased its earnings per share (EPS) by an average of 16% a year, over the last three years (using a line of best fit). In the last year, its revenue is up 155%.
Overall this is a positive result for shareholders, showing that the company has improved in recent years. The combination of strong revenue growth with medium-term earnings per share improvement certainly points to the kind of growth I like to see.
Shareholders might be interested in this free visualization of analyst forecasts. .
Has Akebia Therapeutics, Inc. Been A Good Investment?
Given the total loss of 22% over three years, many shareholders in Akebia Therapeutics, Inc. are probably rather dissatisfied, to say the least. So shareholders would probably think the company shouldn’t be too generous with CEO compensation.
In Summary…
We compared total CEO remuneration at Akebia Therapeutics, Inc. with the amount paid at companies with a similar market capitalization. As discussed above, we discovered that the company pays more than the median of that group.
However, the earnings per share growth over three years is certainly impressive. However, the returns to investors are far less impressive, over the same period. While EPS is positive, we’d say shareholders would want better returns before the CEO is paid much more. So you may want to check if insiders are buying Akebia Therapeutics shares with their own money (free access).
Or you might rather take a peek at this analytical visualization of historic cash flow, earnings and revenue.
To help readers see past the short term volatility of the financial market, we aim to bring you a long-term focused research analysis purely driven by fundamental data. Note that our analysis does not factor in the latest price-sensitive company announcements.
The author is an independent contributor and at the time of publication had no position in the stocks mentioned. For errors that warrant correction please contact the editor at editorial-team@simplywallst.com.
