
 Yahoo Finance
 DHI Group (NYSE:DHX) Could Be Struggling To Allocate Capital
Ignoring the stock price of a company, what are the underlying trends that tell us a business is past the growth phase? More often than not, we'll see a declining return on capital employed (ROCE) and a declining amount of capital employed. This indicates to us that the business is not only shrinking the size of its net assets, but its returns are falling as well. On that note, looking into DHI Group (NYSE:DHX), we weren't too upbeat about how things were going.
What Is Return On Capital Employed (ROCE)?
If you haven't worked with ROCE before, it measures the 'return' (pre-tax profit) a company generates from capital employed in its business. The formula for this calculation on DHI Group is:
Return on Capital Employed = Earnings Before Interest and Tax (EBIT) ÷ (Total Assets - Current Liabilities)
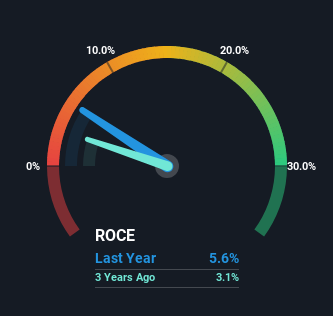
0.056 = US$8.7m ÷ (US$225m - US$69m) (Based on the trailing twelve months to December 2023).
Thus, DHI Group has an ROCE of 5.6%. On its own that's a low return on capital but it's in line with the industry's average returns of 6.4%.
See our latest analysis for DHI Group
In the above chart we have measured DHI Group's prior ROCE against its prior performance, but the future is arguably more important. If you'd like, you can check out the forecasts from the analysts covering DHI Group for free.
The Trend Of ROCE
In terms of DHI Group's historical ROCE movements, the trend doesn't inspire confidence. To be more specific, the ROCE was 9.5% five years ago, but since then it has dropped noticeably. On top of that, it's worth noting that the amount of capital employed within the business has remained relatively steady. This combination can be indicative of a mature business that still has areas to deploy capital, but the returns received aren't as high due potentially to new competition or smaller margins. If these trends continue, we wouldn't expect DHI Group to turn into a multi-bagger.
The Bottom Line On DHI Group's ROCE
In summary, it's unfortunate that DHI Group is generating lower returns from the same amount of capital. Long term shareholders who've owned the stock over the last five years have experienced a 17% depreciation in their investment, so it appears the market might not like these trends either. That being the case, unless the underlying trends revert to a more positive trajectory, we'd consider looking elsewhere.
DHI Group does have some risks, we noticed 3 warning signs (and 1 which can't be ignored) we think you should know about.
If you want to search for solid companies with great earnings, check out this free list of companies with good balance sheets and impressive returns on equity.
Have feedback on this article? Concerned about the content? Get in touch with us directly. Alternatively, email editorial-team (at) simplywallst.com.
This article by Simply Wall St is general in nature. We provide commentary based on historical data and analyst forecasts only using an unbiased methodology and our articles are not intended to be financial advice. It does not constitute a recommendation to buy or sell any stock, and does not take account of your objectives, or your financial situation. We aim to bring you long-term focused analysis driven by fundamental data. Note that our analysis may not factor in the latest price-sensitive company announcements or qualitative material. Simply Wall St has no position in any stocks mentioned.
