
 Yahoo Finance
 Is Detour Gold Corporation’s (TSE:DGC) Balance Sheet A Threat To Its Future?

Investors are always looking for growth in small-cap stocks like Detour Gold Corporation (TSE:DGC), with a market cap of CA$1.82b. However, an important fact which most ignore is: how financially healthy is the business? Assessing first and foremost the financial health is essential, as mismanagement of capital can lead to bankruptcies, which occur at a higher rate for small-caps. Here are a few basic checks that are good enough to have a broad overview of the company’s financial strength. Nevertheless, this commentary is still very high-level, so I suggest you dig deeper yourself into DGC here.
How much cash does DGC generate through its operations?
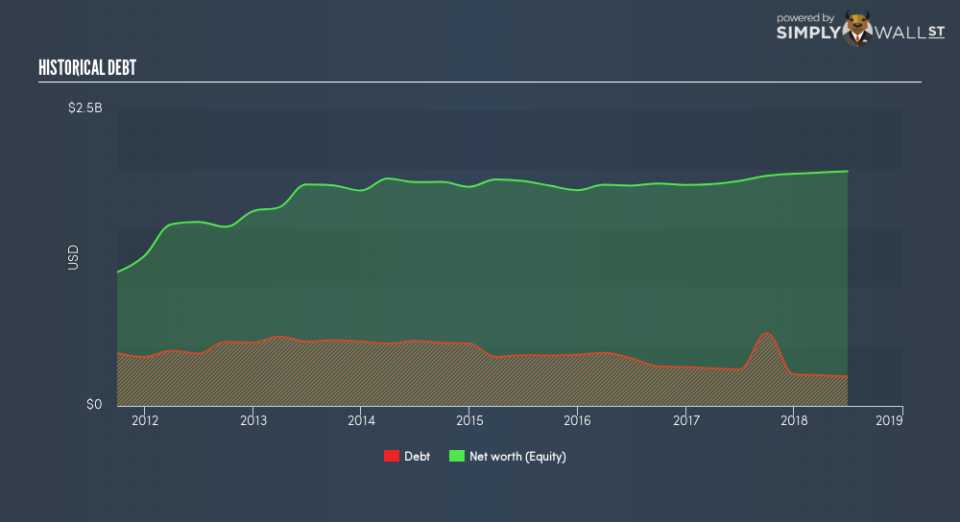
Over the past year, DGC has reduced its debt from US$307.7m to US$248.7m , which is made up of current and long term debt. With this reduction in debt, DGC currently has US$150.3m remaining in cash and short-term investments for investing into the business. Moreover, DGC has produced cash from operations of US$294.0m over the same time period, resulting in an operating cash to total debt ratio of 118%, signalling that DGC’s debt is appropriately covered by operating cash. This ratio can also be a sign of operational efficiency as an alternative to return on assets. In DGC’s case, it is able to generate 1.18x cash from its debt capital.
Can DGC pay its short-term liabilities?
With current liabilities at US$71.6m, it seems that the business has maintained a safe level of current assets to meet its obligations, with the current ratio last standing at 4.15x. However, a ratio greater than 3x may be considered as too high, as DGC could be holding too much capital in a low-return investment environment.
Does DGC face the risk of succumbing to its debt-load?
DGC’s level of debt is appropriate relative to its total equity, at 12.6%. This range is considered safe as DGC is not taking on too much debt obligation, which can be restrictive and risky for equity-holders. We can check to see whether DGC is able to meet its debt obligations by looking at the net interest coverage ratio. A company generating earnings before interest and tax (EBIT) at least three times its net interest payments is considered financially sound. In DGC’s, case, the ratio of 5.32x suggests that interest is appropriately covered, which means that debtors may be willing to loan the company more money, giving DGC ample headroom to grow its debt facilities.
Next Steps:
DGC’s high cash coverage and low debt levels indicate its ability to utilise its borrowings efficiently in order to generate ample cash flow. Furthermore, the company exhibits an ability to meet its near term obligations should an adverse event occur. This is only a rough assessment of financial health, and I’m sure DGC has company-specific issues impacting its capital structure decisions. I recommend you continue to research Detour Gold to get a more holistic view of the stock by looking at:
Future Outlook: What are well-informed industry analysts predicting for DGC’s future growth? Take a look at our free research report of analyst consensus for DGC’s outlook.
Valuation: What is DGC worth today? Is the stock undervalued, even when its growth outlook is factored into its intrinsic value? The intrinsic value infographic in our free research report helps visualize whether DGC is currently mispriced by the market.
Other High-Performing Stocks: Are there other stocks that provide better prospects with proven track records? Explore our free list of these great stocks here.
To help readers see past the short term volatility of the financial market, we aim to bring you a long-term focused research analysis purely driven by fundamental data. Note that our analysis does not factor in the latest price-sensitive company announcements.
The author is an independent contributor and at the time of publication had no position in the stocks mentioned. For errors that warrant correction please contact the editor at editorial-team@simplywallst.com.
