Detached homes account for nearly a third of home-mover purchases, says Halifax
Detached houses were the most popular type of property among existing homeowners moving home with a mortgage in the year to March, according to analysis of a lending giant’s data.
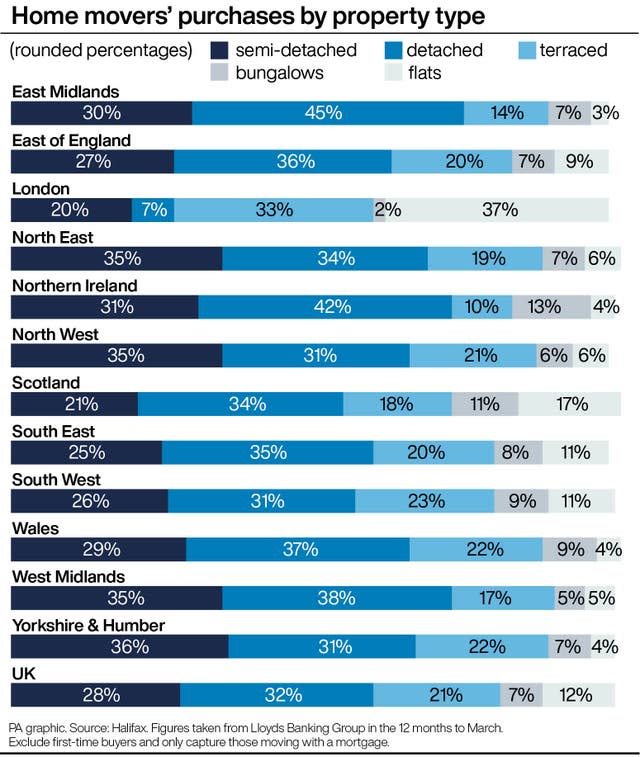
Halifax said detached homes accounted for nearly a third (32%) of such sales, rising from a quarter (25%) a decade ago.
While detached homes were found to be the most popular choice in several parts of the UK over the past year, in London flats came out top and in northern England semi-detached properties were the most popular.

Halifax made the calculations using data from Lloyds Banking Group, which it is part of.
It added that the average age of a UK home mover is now 39, a year younger than 12 months ago, and two years younger than in 2013.
The falling age of movers may point to the “race for space” driven by more businesses permanently adopting homeworking and younger homeowners looking for homes that better fit with their lifestyles, Halifax suggested.
Movers in London are, on average, youngest, at 38, while those in Northern Ireland are the oldest at 41, the bank added.
The cost of the average UK home mover’s property is now double (101% more) what it was in 2013, rising from £213,284 to £428,647, Halifax said.
Kim Kinnaird, mortgages director, Halifax, said: “The growing popularity of detached homes reflects a desire or need for more space.
“With many businesses continuing to embrace hybrid working, we’ve seen people take the opportunity to find homes that better suit their lifestyles in locations that might not have been practical with a daily commute to consider.
“It is also true that detached homes often come as a later step on the housing ladder for many and, when the opportunity arises, families will choose a home that gives them space to settle and grow over a longer period – a ‘forever home’, which will be a more flexible space for their changing needs and lifestyles.
“In contrast, the falling popularity of terraced homes reflects how they are increasingly seen as a first rung on the housing ladder.
“The relatively poor energy efficiency of many older terraced homes could also be a factor when buyers are looking at household running costs as energy costs look set to remain high.”
Commenting on Halifax’s report, Nigel Bishop, founder of Recoco Property Search, said: “Due to the popularity of detached properties, buyers are often facing a competitive house hunt with sellers having the upper hand when it comes to price negotiations.”
Here are home movers’ purchases by property type, according to figures Halifax has taken from Lloyds Banking Group in the 12 months to March. The figures exclude first-time buyers and only capture those moving with a mortgage. The figures show percentages, which have been rounded, for semi-detached homes, followed by detached homes, terraced homes, bungalows and flats:
– East Midlands, 30% 45% 14% 7% 3%
– East of England, 27% 36% 20% 7% 9%
– London, 20% 7% 33% 2% 37%
– North East, 35%, 34%, 19%, 7%, 6%
– Northern Ireland, 31%, 42%, 10%, 13%, 4%
– North West, 35%, 31%, 21%, 6%, 6%
– Scotland, 21%, 34%, 18%, 11%, 17%
– South East, 25%, 35%, 20%, 8%, 11%
– South West, 26%, 31%, 23%, 9%, 11%
– Wales, 29%, 37%, 22%, 9%, 4%
– West Midlands, 35%, 38%, 17%, 5%, 5%
– Yorkshire and the Humber, 36%, 31%, 22%, 7%, 4%
– UK, 28%, 32%, 21%, 7%, 12%

 Yahoo Finance