
 Yahoo Finance
 Despite lower earnings than five years ago, Ultra Clean Holdings (NASDAQ:UCTT) investors are up 57% since then
It's been a soft week for Ultra Clean Holdings, Inc. (NASDAQ:UCTT) shares, which are down 13%. On the bright side the share price is up over the last half decade. Unfortunately its return of 57% is below the market return of 58%. While the long term returns are impressive, we do have some sympathy for those who bought more recently, given the 32% drop, in the last year.
While the stock has fallen 13% this week, it's worth focusing on the longer term and seeing if the stocks historical returns have been driven by the underlying fundamentals.
See our latest analysis for Ultra Clean Holdings
While markets are a powerful pricing mechanism, share prices reflect investor sentiment, not just underlying business performance. By comparing earnings per share (EPS) and share price changes over time, we can get a feel for how investor attitudes to a company have morphed over time.
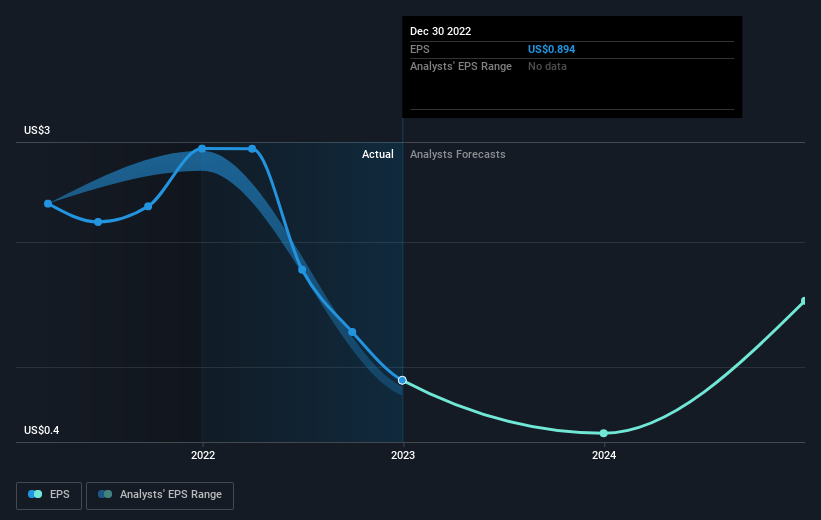
During the last half decade, Ultra Clean Holdings became profitable. That's generally thought to be a genuine positive, so we would expect to see an increasing share price.
You can see how EPS has changed over time in the image below (click on the chart to see the exact values).
It is of course excellent to see how Ultra Clean Holdings has grown profits over the years, but the future is more important for shareholders. You can see how its balance sheet has strengthened (or weakened) over time in this free interactive graphic.
A Different Perspective
While the broader market lost about 10% in the twelve months, Ultra Clean Holdings shareholders did even worse, losing 32%. However, it could simply be that the share price has been impacted by broader market jitters. It might be worth keeping an eye on the fundamentals, in case there's a good opportunity. On the bright side, long term shareholders have made money, with a gain of 9% per year over half a decade. If the fundamental data continues to indicate long term sustainable growth, the current sell-off could be an opportunity worth considering. While it is well worth considering the different impacts that market conditions can have on the share price, there are other factors that are even more important. For example, we've discovered 2 warning signs for Ultra Clean Holdings that you should be aware of before investing here.
For those who like to find winning investments this free list of growing companies with recent insider purchasing, could be just the ticket.
Please note, the market returns quoted in this article reflect the market weighted average returns of stocks that currently trade on US exchanges.
Have feedback on this article? Concerned about the content? Get in touch with us directly. Alternatively, email editorial-team (at) simplywallst.com.
This article by Simply Wall St is general in nature. We provide commentary based on historical data and analyst forecasts only using an unbiased methodology and our articles are not intended to be financial advice. It does not constitute a recommendation to buy or sell any stock, and does not take account of your objectives, or your financial situation. We aim to bring you long-term focused analysis driven by fundamental data. Note that our analysis may not factor in the latest price-sensitive company announcements or qualitative material. Simply Wall St has no position in any stocks mentioned.
Join A Paid User Research Session
You’ll receive a US$30 Amazon Gift card for 1 hour of your time while helping us build better investing tools for the individual investors like yourself. Sign up here
