
 Yahoo Finance
 Despite Its High P/E Ratio, Is Orca Exploration Group Inc. (CVE:ORC.B) Still Undervalued?

The goal of this article is to teach you how to use price to earnings ratios (P/E ratios). To keep it practical, we'll show how Orca Exploration Group Inc.'s (CVE:ORC.B) P/E ratio could help you assess the value on offer. What is Orca Exploration Group's P/E ratio? Well, based on the last twelve months it is 10.55. In other words, at today's prices, investors are paying CA$10.55 for every CA$1 in prior year profit.
See our latest analysis for Orca Exploration Group
How Do I Calculate A Price To Earnings Ratio?
The formula for P/E is:
Price to Earnings Ratio = Share Price (in reporting currency) ÷ Earnings per Share (EPS)
Or for Orca Exploration Group:
P/E of 10.55 = CA$4.54 (Note: this is the share price in the reporting currency, namely, USD ) ÷ CA$0.43 (Based on the trailing twelve months to September 2019.)
Is A High P/E Ratio Good?
A higher P/E ratio means that investors are paying a higher price for each CA$1 of company earnings. That isn't a good or a bad thing on its own, but a high P/E means that buyers have a higher opinion of the business's prospects, relative to stocks with a lower P/E.
Does Orca Exploration Group Have A Relatively High Or Low P/E For Its Industry?
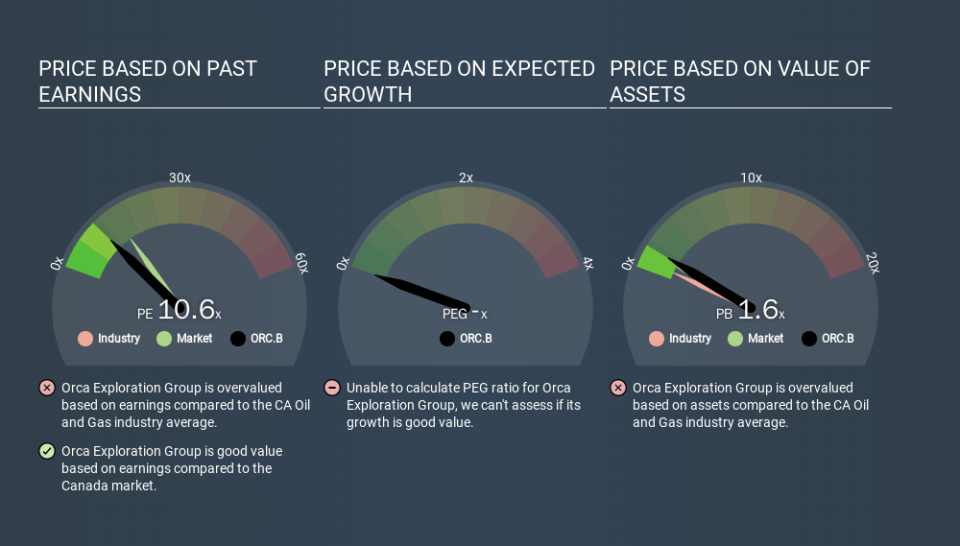
The P/E ratio essentially measures market expectations of a company. The image below shows that Orca Exploration Group has a P/E ratio that is roughly in line with the oil and gas industry average (10.0).
That indicates that the market expects Orca Exploration Group will perform roughly in line with other companies in its industry. If the company has better than average prospects, then the market might be underestimating it. Further research into factors such as insider buying and selling, could help you form your own view on whether that is likely.
How Growth Rates Impact P/E Ratios
Generally speaking the rate of earnings growth has a profound impact on a company's P/E multiple. When earnings grow, the 'E' increases, over time. Therefore, even if you pay a high multiple of earnings now, that multiple will become lower in the future. Then, a lower P/E should attract more buyers, pushing the share price up.
In the last year, Orca Exploration Group grew EPS like Taylor Swift grew her fan base back in 2010; the 159% gain was both fast and well deserved. The cherry on top is that the five year growth rate was an impressive 57% per year. With that kind of growth rate we would generally expect a high P/E ratio.
Don't Forget: The P/E Does Not Account For Debt or Bank Deposits
It's important to note that the P/E ratio considers the market capitalization, not the enterprise value. That means it doesn't take debt or cash into account. Theoretically, a business can improve its earnings (and produce a lower P/E in the future) by investing in growth. That means taking on debt (or spending its cash).
Such expenditure might be good or bad, in the long term, but the point here is that the balance sheet is not reflected by this ratio.
How Does Orca Exploration Group's Debt Impact Its P/E Ratio?
With net cash of US$84m, Orca Exploration Group has a very strong balance sheet, which may be important for its business. Having said that, at 52% of its market capitalization the cash hoard would contribute towards a higher P/E ratio.
The Bottom Line On Orca Exploration Group's P/E Ratio
Orca Exploration Group has a P/E of 10.6. That's below the average in the CA market, which is 15.0. Not only should the net cash position reduce risk, but the recent growth has been impressive. The relatively low P/E ratio implies the market is pessimistic.
Investors have an opportunity when market expectations about a stock are wrong. If it is underestimating a company, investors can make money by buying and holding the shares until the market corrects itself. Although we don't have analyst forecasts shareholders might want to examine this detailed historical graph of earnings, revenue and cash flow.
You might be able to find a better buy than Orca Exploration Group. If you want a selection of possible winners, check out this free list of interesting companies that trade on a P/E below 20 (but have proven they can grow earnings).
If you spot an error that warrants correction, please contact the editor at editorial-team@simplywallst.com. This article by Simply Wall St is general in nature. It does not constitute a recommendation to buy or sell any stock, and does not take account of your objectives, or your financial situation. Simply Wall St has no position in the stocks mentioned.
We aim to bring you long-term focused research analysis driven by fundamental data. Note that our analysis may not factor in the latest price-sensitive company announcements or qualitative material. Thank you for reading.
