
 Yahoo Finance
 Despite Its High P/E Ratio, Is BioSyent Inc. (CVE:RX) Still Undervalued?

This article is written for those who want to get better at using price to earnings ratios (P/E ratios). We'll apply a basic P/E ratio analysis to BioSyent Inc.'s (CVE:RX), to help you decide if the stock is worth further research. Looking at earnings over the last twelve months, BioSyent has a P/E ratio of 18.87. In other words, at today's prices, investors are paying CA$18.87 for every CA$1 in prior year profit.
See our latest analysis for BioSyent
How Do I Calculate A Price To Earnings Ratio?
The formula for price to earnings is:
Price to Earnings Ratio = Price per Share ÷ Earnings per Share (EPS)
Or for BioSyent:
P/E of 18.87 = CA$7.22 ÷ CA$0.38 (Based on the year to March 2019.)
Is A High Price-to-Earnings Ratio Good?
The higher the P/E ratio, the higher the price tag of a business, relative to its trailing earnings. That is not a good or a bad thing per se, but a high P/E does imply buyers are optimistic about the future.
How Does BioSyent's P/E Ratio Compare To Its Peers?
The P/E ratio essentially measures market expectations of a company. The image below shows that BioSyent has a P/E ratio that is roughly in line with the pharmaceuticals industry average (18.9).
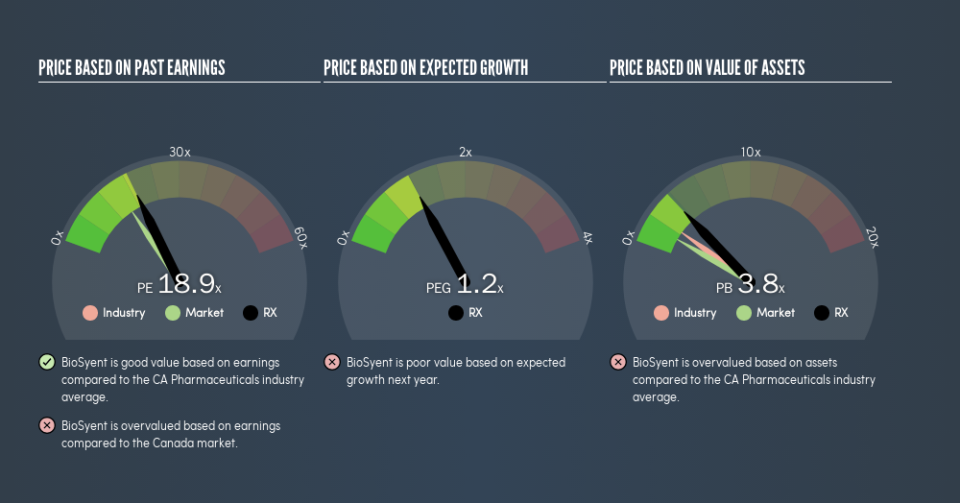
That indicates that the market expects BioSyent will perform roughly in line with other companies in its industry. If the company has better than average prospects, then the market might be underestimating it. Further research into factors such as insider buying and selling, could help you form your own view on whether that is likely.
How Growth Rates Impact P/E Ratios
P/E ratios primarily reflect market expectations around earnings growth rates. When earnings grow, the 'E' increases, over time. That means even if the current P/E is high, it will reduce over time if the share price stays flat. Then, a lower P/E should attract more buyers, pushing the share price up.
BioSyent had pretty flat EPS growth in the last year. But it has grown its earnings per share by 20% per year over the last five years.
Don't Forget: The P/E Does Not Account For Debt or Bank Deposits
It's important to note that the P/E ratio considers the market capitalization, not the enterprise value. In other words, it does not consider any debt or cash that the company may have on the balance sheet. The exact same company would hypothetically deserve a higher P/E ratio if it had a strong balance sheet, than if it had a weak one with lots of debt, because a cashed up company can spend on growth.
Such spending might be good or bad, overall, but the key point here is that you need to look at debt to understand the P/E ratio in context.
BioSyent's Balance Sheet
With net cash of CA$22m, BioSyent has a very strong balance sheet, which may be important for its business. Having said that, at 23% of its market capitalization the cash hoard would contribute towards a higher P/E ratio.
The Verdict On BioSyent's P/E Ratio
BioSyent's P/E is 18.9 which is above average (15.6) in its market. Recent earnings growth wasn't bad. And the healthy balance sheet means the company can sustain growth while the P/E suggests shareholders think it will.
When the market is wrong about a stock, it gives savvy investors an opportunity. If the reality for a company is better than it expects, you can make money by buying and holding for the long term. So this free visual report on analyst forecasts could hold the key to an excellent investment decision.
You might be able to find a better buy than BioSyent. If you want a selection of possible winners, check out this free list of interesting companies that trade on a P/E below 20 (but have proven they can grow earnings).
We aim to bring you long-term focused research analysis driven by fundamental data. Note that our analysis may not factor in the latest price-sensitive company announcements or qualitative material.
If you spot an error that warrants correction, please contact the editor at editorial-team@simplywallst.com. This article by Simply Wall St is general in nature. It does not constitute a recommendation to buy or sell any stock, and does not take account of your objectives, or your financial situation. Simply Wall St has no position in the stocks mentioned. Thank you for reading.
