
 Yahoo Finance
 Despite Its High P/E Ratio, Is Dundee Precious Metals Inc. (TSE:DPM) Still Undervalued?

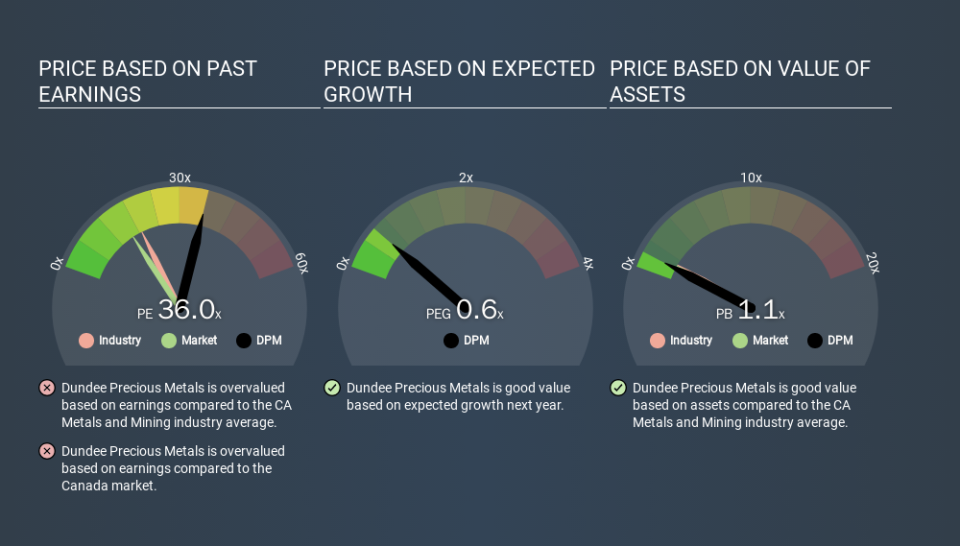
This article is written for those who want to get better at using price to earnings ratios (P/E ratios). We'll look at Dundee Precious Metals Inc.'s (TSE:DPM) P/E ratio and reflect on what it tells us about the company's share price. Looking at earnings over the last twelve months, Dundee Precious Metals has a P/E ratio of 36.04. That means that at current prices, buyers pay CA$36.04 for every CA$1 in trailing yearly profits.
See our latest analysis for Dundee Precious Metals
How Do I Calculate A Price To Earnings Ratio?
The formula for P/E is:
Price to Earnings Ratio = Price per Share (in the reporting currency) ÷ Earnings per Share (EPS)
Or for Dundee Precious Metals:
P/E of 36.04 = CA$4.08 (Note: this is the share price in the reporting currency, namely, USD ) ÷ CA$0.11 (Based on the trailing twelve months to September 2019.)
Is A High Price-to-Earnings Ratio Good?
A higher P/E ratio means that investors are paying a higher price for each CA$1 of company earnings. All else being equal, it's better to pay a low price -- but as Warren Buffett said, 'It's far better to buy a wonderful company at a fair price than a fair company at a wonderful price'.
Does Dundee Precious Metals Have A Relatively High Or Low P/E For Its Industry?
We can get an indication of market expectations by looking at the P/E ratio. As you can see below, Dundee Precious Metals has a higher P/E than the average company (18.7) in the metals and mining industry.
Dundee Precious Metals's P/E tells us that market participants think the company will perform better than its industry peers, going forward. The market is optimistic about the future, but that doesn't guarantee future growth. So investors should delve deeper. I like to check if company insiders have been buying or selling.
How Growth Rates Impact P/E Ratios
P/E ratios primarily reflect market expectations around earnings growth rates. If earnings are growing quickly, then the 'E' in the equation will increase faster than it would otherwise. And in that case, the P/E ratio itself will drop rather quickly. A lower P/E should indicate the stock is cheap relative to others -- and that may attract buyers.
Dundee Precious Metals's earnings per share fell by 47% in the last twelve months.
A Limitation: P/E Ratios Ignore Debt and Cash In The Bank
Don't forget that the P/E ratio considers market capitalization. In other words, it does not consider any debt or cash that the company may have on the balance sheet. In theory, a company can lower its future P/E ratio by using cash or debt to invest in growth.
While growth expenditure doesn't always pay off, the point is that it is a good option to have; but one that the P/E ratio ignores.
How Does Dundee Precious Metals's Debt Impact Its P/E Ratio?
Dundee Precious Metals has net cash of US$6.0m. That should lead to a higher P/E than if it did have debt, because its strong balance sheets gives it more options.
The Verdict On Dundee Precious Metals's P/E Ratio
Dundee Precious Metals's P/E is 36.0 which is above average (15.8) in its market. Falling earnings per share is probably keeping traditional value investors away, but the net cash position means the company has time to improve: and the high P/E suggests the market thinks it will.
Investors should be looking to buy stocks that the market is wrong about. People often underestimate remarkable growth -- so investors can make money when fast growth is not fully appreciated. So this free visual report on analyst forecasts could hold the key to an excellent investment decision.
But note: Dundee Precious Metals may not be the best stock to buy. So take a peek at this free list of interesting companies with strong recent earnings growth (and a P/E ratio below 20).
If you spot an error that warrants correction, please contact the editor at editorial-team@simplywallst.com. This article by Simply Wall St is general in nature. It does not constitute a recommendation to buy or sell any stock, and does not take account of your objectives, or your financial situation. Simply Wall St has no position in the stocks mentioned.
We aim to bring you long-term focused research analysis driven by fundamental data. Note that our analysis may not factor in the latest price-sensitive company announcements or qualitative material. Thank you for reading.
