
 Yahoo Finance
 Despite delivering investors losses of 26% over the past 1 year, Close Brothers Group (LON:CBG) has been growing its earnings
Investors can approximate the average market return by buying an index fund. While individual stocks can be big winners, plenty more fail to generate satisfactory returns. Unfortunately the Close Brothers Group plc (LON:CBG) share price slid 29% over twelve months. That's disappointing when you consider the market declined 4.7%. However, the longer term returns haven't been so bad, with the stock down 20% in the last three years.
Although the past week has been more reassuring for shareholders, they're still in the red over the last year, so let's see if the underlying business has been responsible for the decline.
See our latest analysis for Close Brothers Group
To paraphrase Benjamin Graham: Over the short term the market is a voting machine, but over the long term it's a weighing machine. One imperfect but simple way to consider how the market perception of a company has shifted is to compare the change in the earnings per share (EPS) with the share price movement.
Even though the Close Brothers Group share price is down over the year, its EPS actually improved. It's quite possible that growth expectations may have been unreasonable in the past.
It's fair to say that the share price does not seem to be reflecting the EPS growth. But we might find some different metrics explain the share price movements better.
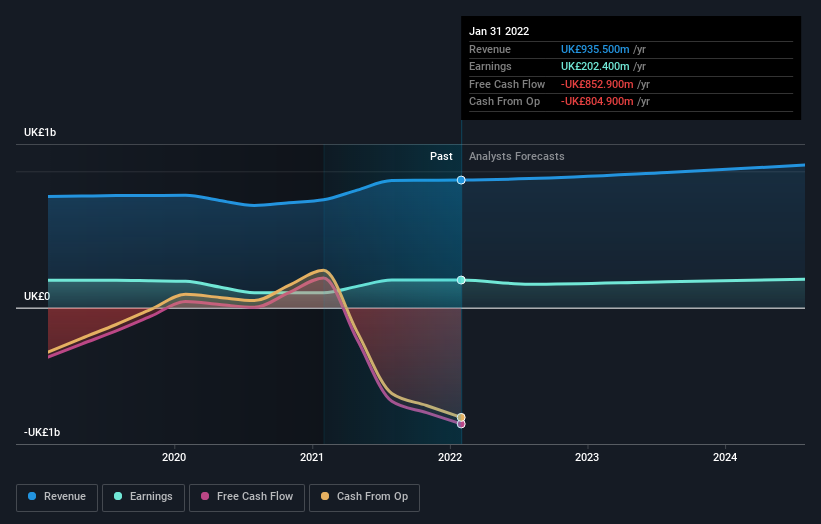
Close Brothers Group's dividend seems healthy to us, so we doubt that the yield is a concern for the market. From what we can see, revenue is pretty flat, so that doesn't really explain the share price drop. Unless, of course, the market was expecting a revenue uptick.
You can see how earnings and revenue have changed over time in the image below (click on the chart to see the exact values).
We like that insiders have been buying shares in the last twelve months. Having said that, most people consider earnings and revenue growth trends to be a more meaningful guide to the business. If you are thinking of buying or selling Close Brothers Group stock, you should check out this free report showing analyst profit forecasts.
What About Dividends?
It is important to consider the total shareholder return, as well as the share price return, for any given stock. The TSR incorporates the value of any spin-offs or discounted capital raisings, along with any dividends, based on the assumption that the dividends are reinvested. So for companies that pay a generous dividend, the TSR is often a lot higher than the share price return. In the case of Close Brothers Group, it has a TSR of -26% for the last 1 year. That exceeds its share price return that we previously mentioned. The dividends paid by the company have thusly boosted the total shareholder return.
A Different Perspective
While the broader market lost about 4.7% in the twelve months, Close Brothers Group shareholders did even worse, losing 26% (even including dividends). However, it could simply be that the share price has been impacted by broader market jitters. It might be worth keeping an eye on the fundamentals, in case there's a good opportunity. Regrettably, last year's performance caps off a bad run, with the shareholders facing a total loss of 2% per year over five years. Generally speaking long term share price weakness can be a bad sign, though contrarian investors might want to research the stock in hope of a turnaround. I find it very interesting to look at share price over the long term as a proxy for business performance. But to truly gain insight, we need to consider other information, too. Like risks, for instance. Every company has them, and we've spotted 2 warning signs for Close Brothers Group (of which 1 doesn't sit too well with us!) you should know about.
There are plenty of other companies that have insiders buying up shares. You probably do not want to miss this free list of growing companies that insiders are buying.
Please note, the market returns quoted in this article reflect the market weighted average returns of stocks that currently trade on GB exchanges.
Have feedback on this article? Concerned about the content? Get in touch with us directly. Alternatively, email editorial-team (at) simplywallst.com.
This article by Simply Wall St is general in nature. We provide commentary based on historical data and analyst forecasts only using an unbiased methodology and our articles are not intended to be financial advice. It does not constitute a recommendation to buy or sell any stock, and does not take account of your objectives, or your financial situation. We aim to bring you long-term focused analysis driven by fundamental data. Note that our analysis may not factor in the latest price-sensitive company announcements or qualitative material. Simply Wall St has no position in any stocks mentioned.
Join A Paid User Research Session
You’ll receive a US$30 Amazon Gift card for 1 hour of your time while helping us build better investing tools for the individual investors like yourself. Sign up here
