
 Yahoo Finance
 Should We Be Delighted With Rockwell Automation, Inc.'s (NYSE:ROK) ROE Of 30%?
Many investors are still learning about the various metrics that can be useful when analysing a stock. This article is for those who would like to learn about Return On Equity (ROE). To keep the lesson grounded in practicality, we'll use ROE to better understand Rockwell Automation, Inc. (NYSE:ROK).
Return on Equity or ROE is a test of how effectively a company is growing its value and managing investors’ money. Simply put, it is used to assess the profitability of a company in relation to its equity capital.
View our latest analysis for Rockwell Automation
How Is ROE Calculated?
Return on equity can be calculated by using the formula:
Return on Equity = Net Profit (from continuing operations) ÷ Shareholders' Equity
So, based on the above formula, the ROE for Rockwell Automation is:
30% = US$919m ÷ US$3.0b (Based on the trailing twelve months to September 2022).
The 'return' is the yearly profit. That means that for every $1 worth of shareholders' equity, the company generated $0.30 in profit.
Does Rockwell Automation Have A Good Return On Equity?
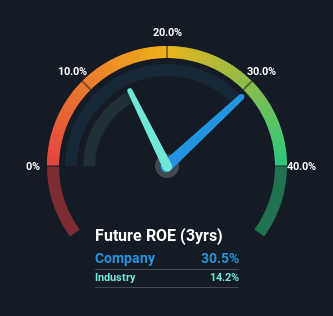
By comparing a company's ROE with its industry average, we can get a quick measure of how good it is. The limitation of this approach is that some companies are quite different from others, even within the same industry classification. As you can see in the graphic below, Rockwell Automation has a higher ROE than the average (14%) in the Electrical industry.
That's what we like to see. However, bear in mind that a high ROE doesn’t necessarily indicate efficient profit generation. Especially when a firm uses high levels of debt to finance its debt which may boost its ROE but the high leverage puts the company at risk. Our risks dashboardshould have the 2 risks we have identified for Rockwell Automation.
How Does Debt Impact Return On Equity?
Companies usually need to invest money to grow their profits. That cash can come from retained earnings, issuing new shares (equity), or debt. In the first two cases, the ROE will capture this use of capital to grow. In the latter case, the debt required for growth will boost returns, but will not impact the shareholders' equity. That will make the ROE look better than if no debt was used.
Rockwell Automation's Debt And Its 30% ROE
It's worth noting the high use of debt by Rockwell Automation, leading to its debt to equity ratio of 1.27. Its ROE is pretty impressive but, it would have probably been lower without the use of debt. Debt increases risk and reduces options for the company in the future, so you generally want to see some good returns from using it.
Conclusion
Return on equity is useful for comparing the quality of different businesses. Companies that can achieve high returns on equity without too much debt are generally of good quality. If two companies have the same ROE, then I would generally prefer the one with less debt.
But when a business is high quality, the market often bids it up to a price that reflects this. The rate at which profits are likely to grow, relative to the expectations of profit growth reflected in the current price, must be considered, too. So I think it may be worth checking this free report on analyst forecasts for the company.
Of course, you might find a fantastic investment by looking elsewhere. So take a peek at this free list of interesting companies.
Have feedback on this article? Concerned about the content? Get in touch with us directly. Alternatively, email editorial-team (at) simplywallst.com.
This article by Simply Wall St is general in nature. We provide commentary based on historical data and analyst forecasts only using an unbiased methodology and our articles are not intended to be financial advice. It does not constitute a recommendation to buy or sell any stock, and does not take account of your objectives, or your financial situation. We aim to bring you long-term focused analysis driven by fundamental data. Note that our analysis may not factor in the latest price-sensitive company announcements or qualitative material. Simply Wall St has no position in any stocks mentioned.
Join A Paid User Research Session
You’ll receive a US$30 Amazon Gift card for 1 hour of your time while helping us build better investing tools for the individual investors like yourself. Sign up here
