
 Yahoo Finance
 Should We Be Delighted With Dicker Data Limited's (ASX:DDR) ROE Of 32%?
While some investors are already well versed in financial metrics (hat tip), this article is for those who would like to learn about Return On Equity (ROE) and why it is important. By way of learning-by-doing, we'll look at ROE to gain a better understanding of Dicker Data Limited (ASX:DDR).
ROE or return on equity is a useful tool to assess how effectively a company can generate returns on the investment it received from its shareholders. In simpler terms, it measures the profitability of a company in relation to shareholder's equity.
Check out our latest analysis for Dicker Data
How Is ROE Calculated?
Return on equity can be calculated by using the formula:
Return on Equity = Net Profit (from continuing operations) ÷ Shareholders' Equity
So, based on the above formula, the ROE for Dicker Data is:
32% = AU$82m ÷ AU$255m (Based on the trailing twelve months to December 2023).
The 'return' refers to a company's earnings over the last year. That means that for every A$1 worth of shareholders' equity, the company generated A$0.32 in profit.
Does Dicker Data Have A Good Return On Equity?
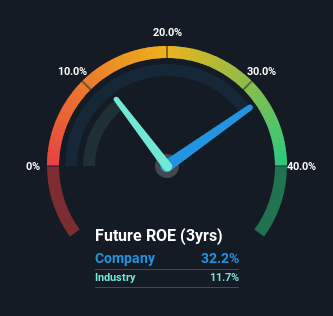
Arguably the easiest way to assess company's ROE is to compare it with the average in its industry. However, this method is only useful as a rough check, because companies do differ quite a bit within the same industry classification. As you can see in the graphic below, Dicker Data has a higher ROE than the average (12%) in the Electronic industry.
That's what we like to see. With that said, a high ROE doesn't always indicate high profitability. Especially when a firm uses high levels of debt to finance its debt which may boost its ROE but the high leverage puts the company at risk. To know the 3 risks we have identified for Dicker Data visit our risks dashboard for free.
Why You Should Consider Debt When Looking At ROE
Virtually all companies need money to invest in the business, to grow profits. That cash can come from issuing shares, retained earnings, or debt. In the case of the first and second options, the ROE will reflect this use of cash, for growth. In the latter case, the use of debt will improve the returns, but will not change the equity. Thus the use of debt can improve ROE, albeit along with extra risk in the case of stormy weather, metaphorically speaking.
Dicker Data's Debt And Its 32% ROE
Dicker Data clearly uses a high amount of debt to boost returns, as it has a debt to equity ratio of 1.18. Its ROE is pretty impressive but, it would have probably been lower without the use of debt. Investors should think carefully about how a company might perform if it was unable to borrow so easily, because credit markets do change over time.
Conclusion
Return on equity is useful for comparing the quality of different businesses. Companies that can achieve high returns on equity without too much debt are generally of good quality. If two companies have around the same level of debt to equity, and one has a higher ROE, I'd generally prefer the one with higher ROE.
But ROE is just one piece of a bigger puzzle, since high quality businesses often trade on high multiples of earnings. It is important to consider other factors, such as future profit growth -- and how much investment is required going forward. So you might want to take a peek at this data-rich interactive graph of forecasts for the company.
Of course Dicker Data may not be the best stock to buy. So you may wish to see this free collection of other companies that have high ROE and low debt.
Have feedback on this article? Concerned about the content? Get in touch with us directly. Alternatively, email editorial-team (at) simplywallst.com.
This article by Simply Wall St is general in nature. We provide commentary based on historical data and analyst forecasts only using an unbiased methodology and our articles are not intended to be financial advice. It does not constitute a recommendation to buy or sell any stock, and does not take account of your objectives, or your financial situation. We aim to bring you long-term focused analysis driven by fundamental data. Note that our analysis may not factor in the latest price-sensitive company announcements or qualitative material. Simply Wall St has no position in any stocks mentioned.
