
 Yahoo Finance
 A Deep Dive into 2023's Surprising Trends (8 Extreme Charts)
The Uniqueness of 2023
“The Stock market is never obvious. It is designed to fool most of the people, most of the time.” ~ Jesse Livermore
2023 is a perfect example of how Wall Street is never obvious. Coming off a massive correction in tech stocks last year, most sentiment measures suggested that investors were bearish into 2023. As is often the case, stocks did the exact opposite of what the crowd anticipated. The Nasdaq 100 ETF (QQQ), the weakest index in 2022, became the strongest in 2023. Oil prices rebounded, Bitcoin decoupled, and the Regional Banking ETF (KRE) crashed amidst regional banking contagion fears. Below are 8 of the most mind-blowing market-related charts for 2023:
Small-Caps are in their Longest Bear Market Ever
A rising interest rate environment (like 2023) is bearish for small-cap stocks due to their impact on borrowing costs. Small-cap companies within the Russell 2000 Index ETF (IWM) rely on borrowing to fuel growth and expansion because they might not have as much access to capital as larger, more established companies. When interest rates increase, borrowing becomes more expensive, leading to higher operational costs and reduced profitability. The Russell 2000 Index last made a 52-week high nearly 500 days ago. When it’s all said and done, the current correction will be longer (from a time perspective) than any other small-cap correction in Russell 2000 history.
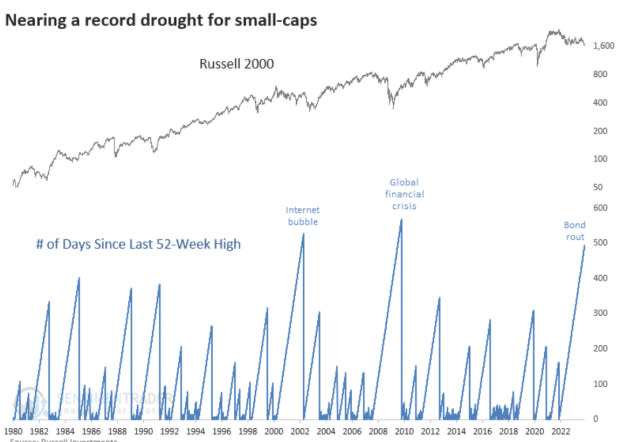
Image Source: Sentiment Trader
The Accuracy of Historical Seasonality
Historical, recurring seasonality trends have been the best guide for investors in 2023. The presidential seasonality cycle predicted a rally in early 2023, followed by a correction, and finally, and end-of-year rally. Seasonality suggests that the S&P 500 Index bottoms on October 27th on average.
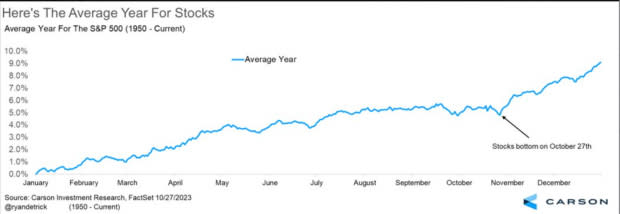
Image Source: Ryan Detrick, Carson Research
New Highs-Lows
The NYSE New Highs – Lows Index shows use that there have been no net new highs since September. For bulls to take back control, this trend will have to change.
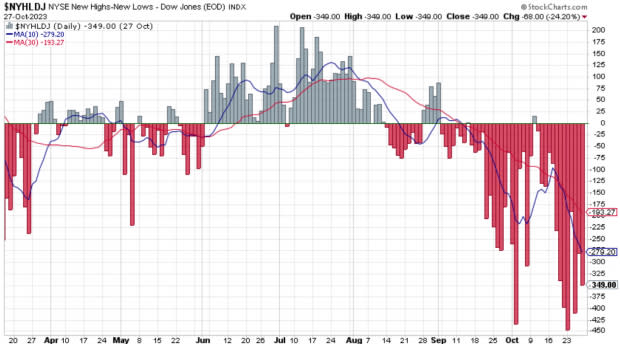
Image Source: Stockcharts.com
Equal Weight Versus Market Weight
The “Magnificent Seven” includes big-tech juggernautsApple (AAPL), Microsft (MSFT), Alphabet (GOOGL), Amazon (AMZN), Nvidia (NVDA), Tesla (TSLA), and Meta Platforms (META). Every member of the group is up double digits year-to-date. Because of their sheer size and performance, these stocks are clearly buoying the market. To achieve a sustained bull market, stocks outside of this group will need to participate.
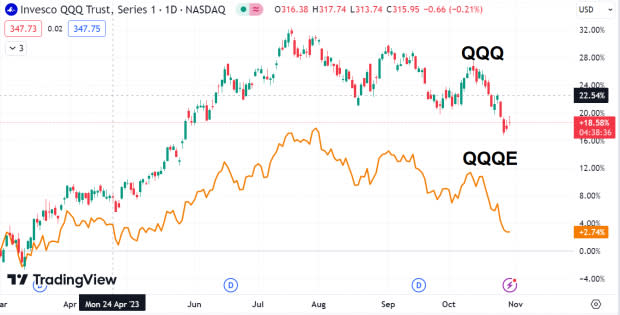
Image Source: TradingView
November is Strong for Tech Stocks
While things may seem grim for tech investors, the Nasdaq 100 ETF (QQQ) has been green 9 of the past 10 Novembers with an average return of 3.37%.
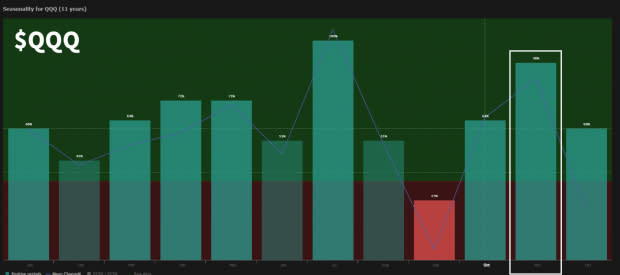
Image Source: TrendSpider
Number of Nasdaq 100 Stocks Above 100-Day MA
Only 14 stocks in the Nasdaq 100 are above their 100-day simple moving averages, marking the lowest levels since September 2022 (right before the market bottomed)
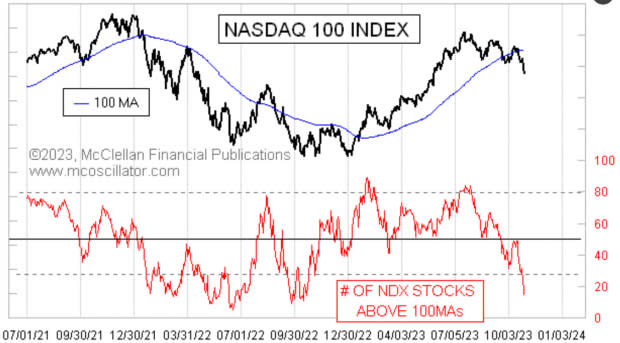
Image Source: McClellan Financial Publications
Is the SPAC / MEME Craze Over?
The number of Special Purpose Acquisition Companies (SPACs) going public has fallen off a cliff. SPACs and meme stocks catapulted to the forefront during the post-Covid, government subsidy-driven bull market. However, they come with significant risks. Namely, SPACs essentially invest in a blank-check company, now knowing which company the SPAC will acquire. Investors are back to being more selective and focused on quality, liquidity, and profitability.
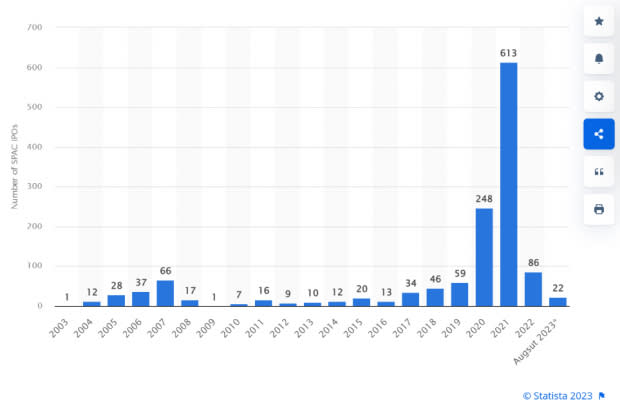
Image Source: Statista
US Dollar: Raging Bull Market
The US Dollar ETF (UUP) is up 15 of the past 17 weeks. A strong dollar can be a headwind for equities because it makes US exports more expensive, reducing overseas sales for multinational companies. Equity bulls need to see the dollar break for a sustained bull market.
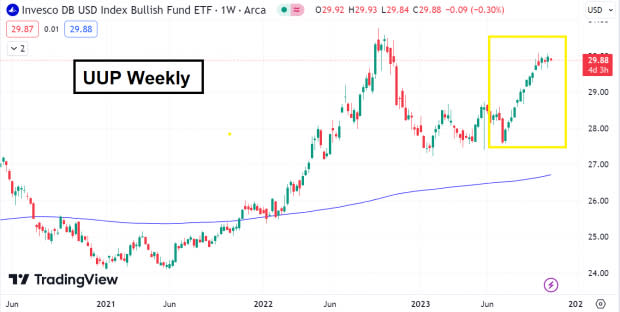
Image Source: TradingView
Bottom Line
Like a fingerprint, each market is unique. However, 2023 is especially abnormal, with many extremes. Investors should monitor the charts in this article, as extremes in one direction often bring about opportunities in the opposite direction.
Want the latest recommendations from Zacks Investment Research? Today, you can download 7 Best Stocks for the Next 30 Days. Click to get this free report
Amazon.com, Inc. (AMZN) : Free Stock Analysis Report
Apple Inc. (AAPL) : Free Stock Analysis Report
Microsoft Corporation (MSFT) : Free Stock Analysis Report
NVIDIA Corporation (NVDA) : Free Stock Analysis Report
Tesla, Inc. (TSLA) : Free Stock Analysis Report
Invesco QQQ (QQQ): ETF Research Reports
Invesco DB US Dollar Index Bullish ETF (UUP): ETF Research Reports
iShares Russell 2000 ETF (IWM): ETF Research Reports
Alphabet Inc. (GOOGL) : Free Stock Analysis Report
SPDR S&P Regional Banking ETF (KRE): ETF Research Reports
Meta Platforms, Inc. (META) : Free Stock Analysis Report
