
 Yahoo Finance
 Declining Stock and Solid Fundamentals: Is The Market Wrong About Momo Inc. (NASDAQ:MOMO)?
It is hard to get excited after looking at Momo's (NASDAQ:MOMO) recent performance, when its stock has declined 16% over the past month. However, a closer look at its sound financials might cause you to think again. Given that fundamentals usually drive long-term market outcomes, the company is worth looking at. In this article, we decided to focus on Momo's ROE.
Return on equity or ROE is an important factor to be considered by a shareholder because it tells them how effectively their capital is being reinvested. Simply put, it is used to assess the profitability of a company in relation to its equity capital.
See our latest analysis for Momo
How Do You Calculate Return On Equity?
ROE can be calculated by using the formula:
Return on Equity = Net Profit (from continuing operations) ÷ Shareholders' Equity
So, based on the above formula, the ROE for Momo is:
14% = CN¥2.0b ÷ CN¥15b (Based on the trailing twelve months to March 2021).
The 'return' is the amount earned after tax over the last twelve months. That means that for every $1 worth of shareholders' equity, the company generated $0.14 in profit.
What Is The Relationship Between ROE And Earnings Growth?
Thus far, we have learned that ROE measures how efficiently a company is generating its profits. Depending on how much of these profits the company reinvests or "retains", and how effectively it does so, we are then able to assess a company’s earnings growth potential. Assuming everything else remains unchanged, the higher the ROE and profit retention, the higher the growth rate of a company compared to companies that don't necessarily bear these characteristics.
Momo's Earnings Growth And 14% ROE
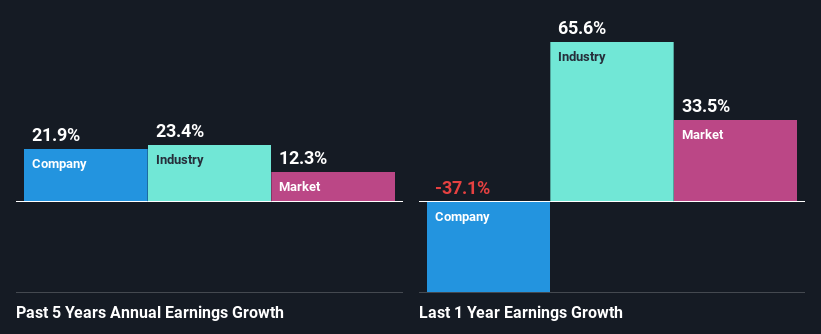
To start with, Momo's ROE looks acceptable. Even when compared to the industry average of 14% the company's ROE looks quite decent. Consequently, this likely laid the ground for the impressive net income growth of 22% seen over the past five years by Momo. We reckon that there could also be other factors at play here. Such as - high earnings retention or an efficient management in place.
Next, on comparing Momo's net income growth with the industry, we found that the company's reported growth is similar to the industry average growth rate of 23% in the same period.
Earnings growth is a huge factor in stock valuation. It’s important for an investor to know whether the market has priced in the company's expected earnings growth (or decline). Doing so will help them establish if the stock's future looks promising or ominous. Is Momo fairly valued compared to other companies? These 3 valuation measures might help you decide.
Is Momo Using Its Retained Earnings Effectively?
Conclusion
On the whole, we feel that Momo's performance has been quite good. Specifically, we like that the company is reinvesting a huge chunk of its profits at a high rate of return. This of course has caused the company to see substantial growth in its earnings. We also studied the latest analyst forecasts and found that the company's earnings growth is expected be similar to its current growth rate. To know more about the company's future earnings growth forecasts take a look at this free report on analyst forecasts for the company to find out more.
This article by Simply Wall St is general in nature. It does not constitute a recommendation to buy or sell any stock, and does not take account of your objectives, or your financial situation. We aim to bring you long-term focused analysis driven by fundamental data. Note that our analysis may not factor in the latest price-sensitive company announcements or qualitative material. Simply Wall St has no position in any stocks mentioned.
Have feedback on this article? Concerned about the content? Get in touch with us directly. Alternatively, email editorial-team (at) simplywallst.com.
