
 Yahoo Finance
 Declining Stock and Decent Financials: Is The Market Wrong About Safety Insurance Group, Inc. (NASDAQ:SAFT)?
With its stock down 10% over the past month, it is easy to disregard Safety Insurance Group (NASDAQ:SAFT). But if you pay close attention, you might find that its key financial indicators look quite decent, which could mean that the stock could potentially rise in the long-term given how markets usually reward more resilient long-term fundamentals. Particularly, we will be paying attention to Safety Insurance Group's ROE today.
Return on equity or ROE is an important factor to be considered by a shareholder because it tells them how effectively their capital is being reinvested. In other words, it is a profitability ratio which measures the rate of return on the capital provided by the company's shareholders.
View our latest analysis for Safety Insurance Group
How Do You Calculate Return On Equity?
The formula for return on equity is:
Return on Equity = Net Profit (from continuing operations) ÷ Shareholders' Equity
So, based on the above formula, the ROE for Safety Insurance Group is:
8.9% = US$73m ÷ US$819m (Based on the trailing twelve months to June 2022).
The 'return' is the profit over the last twelve months. Another way to think of that is that for every $1 worth of equity, the company was able to earn $0.09 in profit.
What Has ROE Got To Do With Earnings Growth?
Thus far, we have learned that ROE measures how efficiently a company is generating its profits. We now need to evaluate how much profit the company reinvests or "retains" for future growth which then gives us an idea about the growth potential of the company. Assuming all else is equal, companies that have both a higher return on equity and higher profit retention are usually the ones that have a higher growth rate when compared to companies that don't have the same features.
A Side By Side comparison of Safety Insurance Group's Earnings Growth And 8.9% ROE
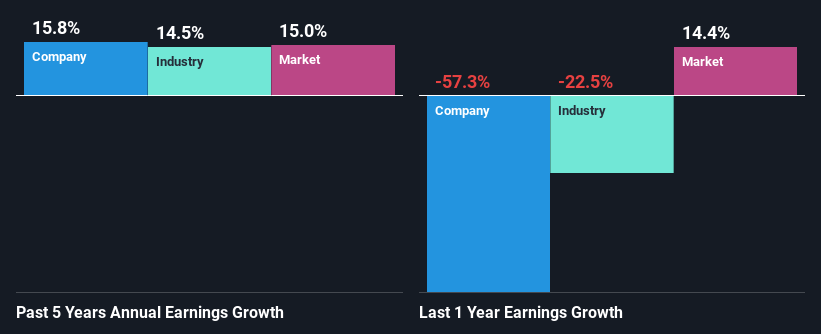
On the face of it, Safety Insurance Group's ROE is not much to talk about. A quick further study shows that the company's ROE doesn't compare favorably to the industry average of 12% either. Although, we can see that Safety Insurance Group saw a modest net income growth of 16% over the past five years. So, the growth in the company's earnings could probably have been caused by other variables. Such as - high earnings retention or an efficient management in place.
Next, on comparing Safety Insurance Group's net income growth with the industry, we found that the company's reported growth is similar to the industry average growth rate of 14% in the same period.
Earnings growth is a huge factor in stock valuation. What investors need to determine next is if the expected earnings growth, or the lack of it, is already built into the share price. This then helps them determine if the stock is placed for a bright or bleak future. Is Safety Insurance Group fairly valued compared to other companies? These 3 valuation measures might help you decide.
Is Safety Insurance Group Making Efficient Use Of Its Profits?
Safety Insurance Group has a healthy combination of a moderate three-year median payout ratio of 48% (or a retention ratio of 52%) and a respectable amount of growth in earnings as we saw above, meaning that the company has been making efficient use of its profits.
Moreover, Safety Insurance Group is determined to keep sharing its profits with shareholders which we infer from its long history of paying a dividend for at least ten years.
Conclusion
On the whole, we do feel that Safety Insurance Group has some positive attributes. Despite its low rate of return, the fact that the company reinvests a very high portion of its profits into its business, no doubt contributed to its high earnings growth. While we won't completely dismiss the company, what we would do, is try to ascertain how risky the business is to make a more informed decision around the company. To know the 1 risk we have identified for Safety Insurance Group visit our risks dashboard for free.
Have feedback on this article? Concerned about the content? Get in touch with us directly. Alternatively, email editorial-team (at) simplywallst.com.
This article by Simply Wall St is general in nature. We provide commentary based on historical data and analyst forecasts only using an unbiased methodology and our articles are not intended to be financial advice. It does not constitute a recommendation to buy or sell any stock, and does not take account of your objectives, or your financial situation. We aim to bring you long-term focused analysis driven by fundamental data. Note that our analysis may not factor in the latest price-sensitive company announcements or qualitative material. Simply Wall St has no position in any stocks mentioned.
Join A Paid User Research Session
You’ll receive a US$30 Amazon Gift card for 1 hour of your time while helping us build better investing tools for the individual investors like yourself. Sign up here
