
 Yahoo Finance
 Daily Grains Analysis for February 21, 2018
Grain prices moved higher in the past week lead by soybean futures which closed higher on a weekly basis for the fourth time in the past five weeks. Soybean prices for March and May delivery increased 3.9%, per bushel. Export activity slipped, falling 14% to 640 TMT for the 2017/18 season and was 13% below the prior 4-week average of 740 TMT. Total export commitments are 78% of projections with 29 weeks to go and need to average 425 TMT in weekly sales to meet forecast. Current export sales are 13% behind last year’s pace.
Corn Prices
Corn prices consolidated and continues to trade in a tight range weighing for an additional catalyst to drive prices higher. Support is seen near the 10-day moving average at 3.65 per bushel. The first level of target resistance is seen near the August highs at 3.75 per bushel. Momentum is accelerating higher as the MACD (moving average convergence divergence) histogram prints in the black with an upward sloping trajectory which points to higher prices. The RSI continues to hover just below the overbought trigger level of 70.

Soybean Prices
Soybean prices whipsawed after hitting a higher high following a breakout in prices at the end of last week. Export activity slipped, falling 14% to 640 TMT for the 2017/18 season and was 13% below the prior 4-week average of 740 TMT. Total export commitments are 78% of projections with 29 weeks to go and need to average 425 TMT in weekly sales to meet forecast. Current export sales are 13% behind last year’s pace.
Support on soybeans is seen near a downward sloping trend line that comes in near 1010. Momentum is accelerating higher as the MACD (moving average convergence divergence) histogram prints in the black with an upward sloping trajectory which points to higher prices. The RSI (relative strength index) is moving sideways coming down after hitting the overbought trigger level of 70.

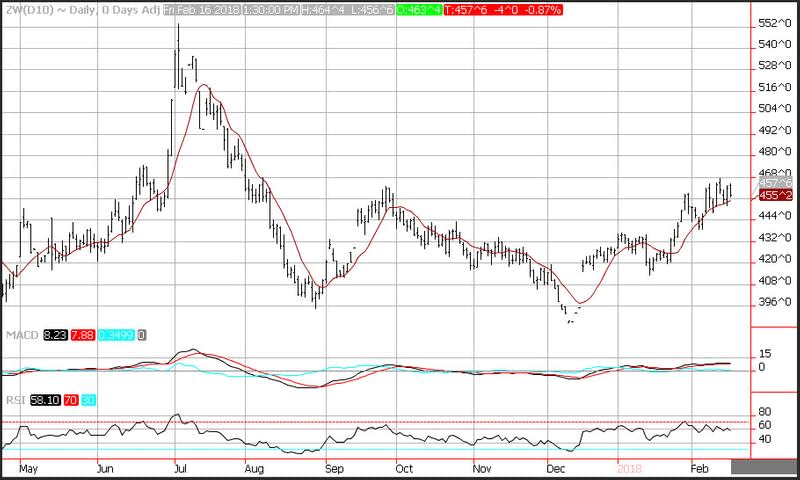
Wheat Prices
Wheat prices consolidated and continue to grind higher. Support on wheat futures prices is seen near near the 10-day moving average at 4.55. Resistance is seen near the February highs at 4.59. Momentum is neutral as the MACD (moving average convergence divergence) histogram prints near the zero-index level with a flat trajectory which points to consolidation. The RSI (relative strength index) is moving sideways which reflects consolidation as it prints a reading of 58 which is in the middle of the neutral range.
This article was originally posted on FX Empire
