
 Yahoo Finance
 D-BOX Technologies (TSE:DBO) Is Experiencing Growth In Returns On Capital
If we want to find a stock that could multiply over the long term, what are the underlying trends we should look for? Firstly, we'd want to identify a growing return on capital employed (ROCE) and then alongside that, an ever-increasing base of capital employed. Basically this means that a company has profitable initiatives that it can continue to reinvest in, which is a trait of a compounding machine. With that in mind, we've noticed some promising trends at D-BOX Technologies (TSE:DBO) so let's look a bit deeper.
Understanding Return On Capital Employed (ROCE)
Just to clarify if you're unsure, ROCE is a metric for evaluating how much pre-tax income (in percentage terms) a company earns on the capital invested in its business. To calculate this metric for D-BOX Technologies, this is the formula:
Return on Capital Employed = Earnings Before Interest and Tax (EBIT) ÷ (Total Assets - Current Liabilities)
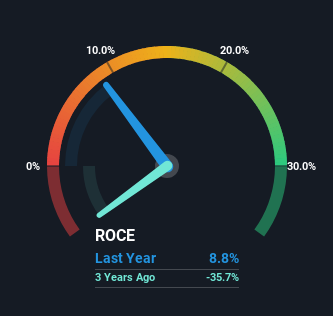
0.088 = CA$1.2m ÷ (CA$21m - CA$6.8m) (Based on the trailing twelve months to March 2024).
So, D-BOX Technologies has an ROCE of 8.8%. Ultimately, that's a low return and it under-performs the Consumer Durables industry average of 14%.
Check out our latest analysis for D-BOX Technologies
While the past is not representative of the future, it can be helpful to know how a company has performed historically, which is why we have this chart above. If you want to delve into the historical earnings , check out these free graphs detailing revenue and cash flow performance of D-BOX Technologies.
So How Is D-BOX Technologies' ROCE Trending?
We're delighted to see that D-BOX Technologies is reaping rewards from its investments and has now broken into profitability. While the business is profitable now, it used to be incurring losses on invested capital five years ago. In regards to capital employed, D-BOX Technologies is using 34% less capital than it was five years ago, which on the surface, can indicate that the business has become more efficient at generating these returns. The reduction could indicate that the company is selling some assets, and considering returns are up, they appear to be selling the right ones.
Our Take On D-BOX Technologies' ROCE
In the end, D-BOX Technologies has proven it's capital allocation skills are good with those higher returns from less amount of capital. And since the stock has fallen 52% over the last five years, there might be an opportunity here. So researching this company further and determining whether or not these trends will continue seems justified.
One more thing, we've spotted 2 warning signs facing D-BOX Technologies that you might find interesting.
For those who like to invest in solid companies, check out this free list of companies with solid balance sheets and high returns on equity.
Have feedback on this article? Concerned about the content? Get in touch with us directly. Alternatively, email editorial-team (at) simplywallst.com.
This article by Simply Wall St is general in nature. We provide commentary based on historical data and analyst forecasts only using an unbiased methodology and our articles are not intended to be financial advice. It does not constitute a recommendation to buy or sell any stock, and does not take account of your objectives, or your financial situation. We aim to bring you long-term focused analysis driven by fundamental data. Note that our analysis may not factor in the latest price-sensitive company announcements or qualitative material. Simply Wall St has no position in any stocks mentioned.
Have feedback on this article? Concerned about the content? Get in touch with us directly. Alternatively, email editorial-team@simplywallst.com
