
 Yahoo Finance
 Is Cub Energy (CVE:KUB) Using Debt In A Risky Way?

Some say volatility, rather than debt, is the best way to think about risk as an investor, but Warren Buffett famously said that 'Volatility is far from synonymous with risk.' It's only natural to consider a company's balance sheet when you examine how risky it is, since debt is often involved when a business collapses. Importantly, Cub Energy Inc. (CVE:KUB) does carry debt. But should shareholders be worried about its use of debt?
When Is Debt A Problem?
Debt is a tool to help businesses grow, but if a business is incapable of paying off its lenders, then it exists at their mercy. If things get really bad, the lenders can take control of the business. While that is not too common, we often do see indebted companies permanently diluting shareholders because lenders force them to raise capital at a distressed price. Of course, the upside of debt is that it often represents cheap capital, especially when it replaces dilution in a company with the ability to reinvest at high rates of return. The first thing to do when considering how much debt a business uses is to look at its cash and debt together.
See our latest analysis for Cub Energy
What Is Cub Energy's Debt?
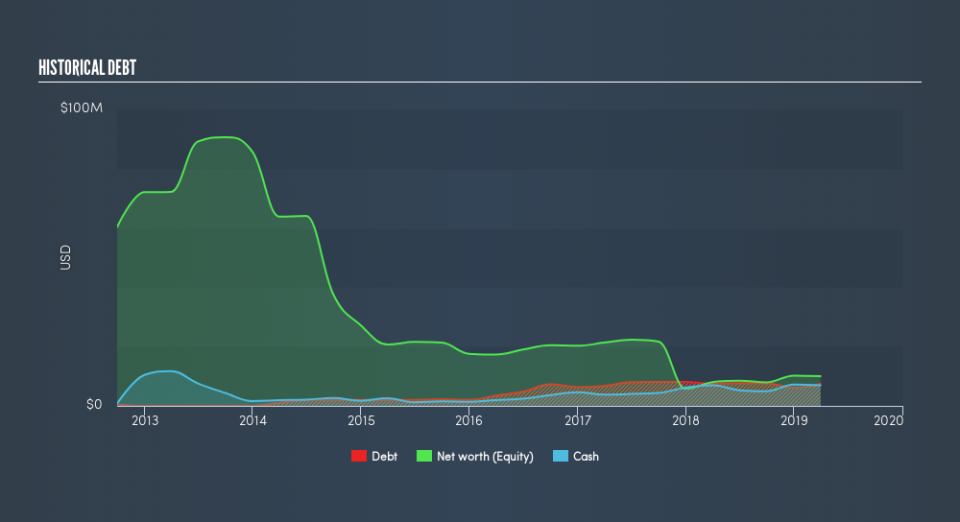
The chart below, which you can click on for greater detail, shows that Cub Energy had US$7.48m in debt in March 2019; about the same as the year before. On the flip side, it has US$6.96m in cash leading to net debt of about US$521.0k.
A Look At Cub Energy's Liabilities
The latest balance sheet data shows that Cub Energy had liabilities of US$9.86m due within a year, and liabilities of US$2.48m falling due after that. Offsetting this, it had US$6.96m in cash and US$2.33m in receivables that were due within 12 months. So it has liabilities totalling US$3.06m more than its cash and near-term receivables, combined.
Since publicly traded Cub Energy shares are worth a total of US$19.1m, it seems unlikely that this level of liabilities would be a major threat. Having said that, it's clear that we should continue to monitor its balance sheet, lest it change for the worse. There's no doubt that we learn most about debt from the balance sheet. But it is Cub Energy's earnings that will influence how the balance sheet holds up in the future. So when considering debt, it's definitely worth looking at the earnings trend. Click here for an interactive snapshot.
In the last year Cub Energy managed to grow its revenue by 31%, to US$19m. Shareholders probably have their fingers crossed that it can grow its way to profits.
Caveat Emptor
Even though Cub Energy managed to grow its top line quite deftly, the cold hard truth is that it is losing money on the EBIT line. Its EBIT loss was a whopping US$2.2m. Considering that alongside the liabilities mentioned above does not give us much confidence that company should be using so much debt. Quite frankly we think the balance sheet is far from match-fit, although it could be improved with time. Surprisingly, we note that it actually reported positive free cash flow of US$800k and a profit of US$3.3m. So if we focus on those metrics there seems to be a chance the company will manage its debt without much trouble. When we look at a riskier company, we like to check how their profits (or losses) are trending over time. Today, we're providing readers this interactive graph showing how Cub Energy's profit, revenue, and operating cashflow have changed over the last few years.
Of course, if you're the type of investor who prefers buying stocks without the burden of debt, then don't hesitate to discover our exclusive list of net cash growth stocks, today.
We aim to bring you long-term focused research analysis driven by fundamental data. Note that our analysis may not factor in the latest price-sensitive company announcements or qualitative material.
If you spot an error that warrants correction, please contact the editor at editorial-team@simplywallst.com. This article by Simply Wall St is general in nature. It does not constitute a recommendation to buy or sell any stock, and does not take account of your objectives, or your financial situation. Simply Wall St has no position in the stocks mentioned. Thank you for reading.
