
 Yahoo Finance
 Crude Oil Rout Continues, SPX 500 Vulnerable to Deeper Losses
DailyFX.com -
Talking Points:
US Dollar in Consolidation Mode Ahead FOMC Outcome
S&P 500 Vulnerable to Deeper Losses After Support Break
Gold Drop Pauses at Support , Crude Oil Drop Continues
Can’t access the Dow Jones FXCM US Dollar Index? Try the USD basket on Mirror Trader. **
US DOLLAR TECHNICAL ANALYSIS – Prices turned lower from a five-year high as expected after completing a bearish Evening Star candlestick pattern. Near-term support is at 11379, the 23.6% Fibonacci retracement, with a break below that on a daily closing basis exposing the 38.2% level at 11291. Alternatively, a reversal above the 14.6% Fib at 11434 clears the way for a test December 8 high at 11522.
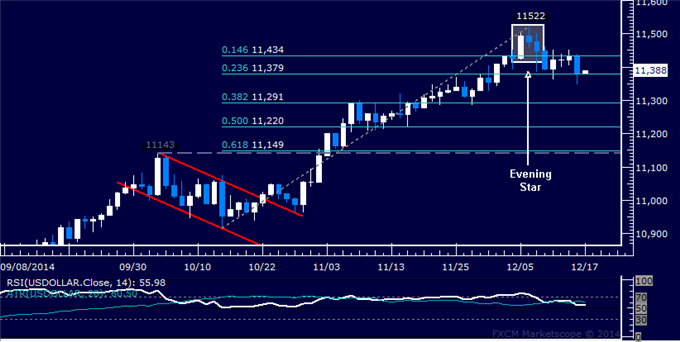
Daily Chart - Created Using FXCM Marketscope
** The Dow Jones FXCM US Dollar Index and the Mirror Trader USD basket are not the same product.
S&P 500 TECHNICAL ANALYSIS – Prices turned lower as expected. Sellers now aim to challenge the 50% Fibonacci retracement at 1949.30, with a break below that exposing the 61.8% level at 1918.50. Alternatively, a reversal above the 38.2% Fib at 1980.00 targets the 2018.10-22.10areamarked by the 23.6%Fib and theSeptember 19 high.
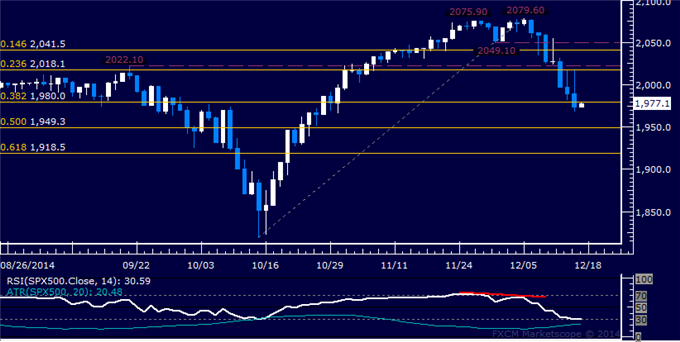
Daily Chart - Created Using FXCM Marketscope
GOLD TECHNICAL ANALYSIS – Prices paused to consolidate at chart support after railing from resistance below $1250.00. A break below the 23.6% Fibonacci expansion at 1187.39 exposes the 38.2% level at 1156.00. Alternatively, a reversal above the 14.6% Fib at 1206.75 targets the December 9 high at 1238.13.

Daily Chart - Created Using FXCM Marketscope
CRUDE OIL TECHNICAL ANALYSIS – Prices are aiming to extend the latest losing streak for a sixth consecutive day. A break below the 100% Fibonacci expansion at 58.93 exposes the 123.6% level at 55.61. Alternatively, a reversal above the 76.4% Fib at 62.25 targets the 61.8% expansion at 64.30.

Daily Chart - Created Using FXCM Marketscope
--- Written by Ilya Spivak, Currency Strategist for DailyFX.com
To receive Ilya's analysis directly via email, please SIGN UP HERE
Contact and follow Ilya on Twitter: @IlyaSpivak
DailyFX provides forex news and technical analysis on the trends that influence the global currency markets.
Learn forex trading with a free practice account and trading charts from FXCM.
