
 Yahoo Finance
 Crude Oil Price Update – Downside Momentum Could Drive Market into $62.99
U.S. West Texas Intermediate crude oil futures are trading lower early Monday. The price action suggests investors continue to expect OPEC and several major non-OPEC producers to announce an increase in production at the meeting in Vienna on June 22-23. Early guesses are for Saudi Arabia and Russia to push for an increase in output of about 1 million barrels per day.
At 0200 GMT, August Comex Gold futures are trading
Daily Technical Analysis
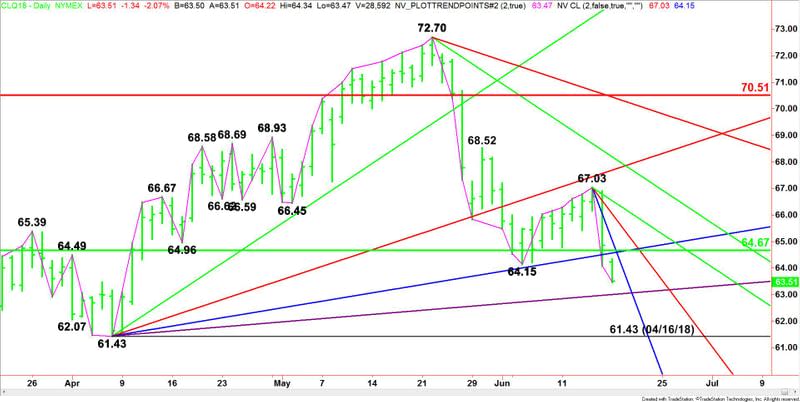
The main trend is down according to the daily swing chart. The downtrend was reaffirmed when sellers took out the previous main bottom at $64.15 on Friday. The next major downside target is the April 16 bottom at $61.43. The main trend will change to up if buyers can take out $67.03.
The market is also trading on the weak side of the contract’s 50% level at $64.67. This price is resistance.
Daily Technical Forecast
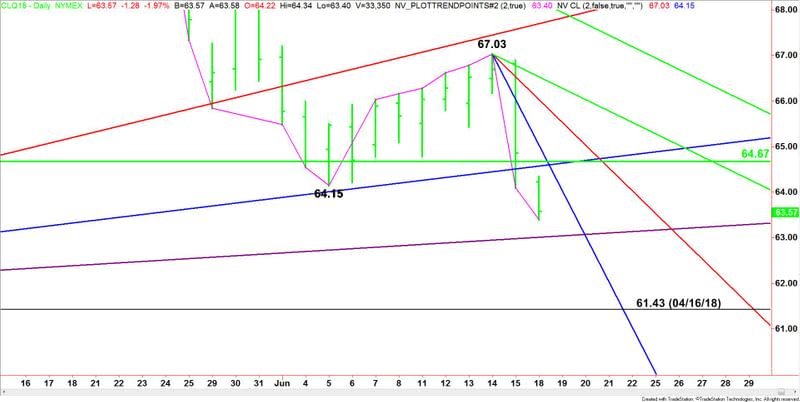
Based on Friday’s close at $64.85 and the early price action, the direction of August Comex Gold futures on Monday is likely to be determined by trader reaction to a pair of Gann angles at $64.56 and $65.03.
A sustained move under $64.56 will indicate the presence of sellers. The daily chart is wide open to the downside with the first target an uptrending Gann angle at $62.99. This price is the last potential support angle before the $61.43 main bottom.
A sustained move over $65.03 will signal the presence of buyers. This move could create the upside momentum needed to challenge the next downtrending Gann angle at $66.03.
Early Monday, momentum is clearly to the downside so we may see a technical bounce on the first test of $62.99. However, if it fails, look for the selling to extend.
This article was originally posted on FX Empire
More From FXEMPIRE:
USD/JPY Fundamental Daily Forecast – Repatriation, Safe-Haven Buying Driving Investors into Yen
Price of Gold Fundamental Daily Forecast – Look for Recovery if US-China Trade War Escalates
Crude Oil Price Update – Downside Momentum Could Drive Market into $62.99
The Week Ahead – Trade Wars, OPEC and the BoE in Focus – 16/06/18
Natural Gas Price Fundamental Daily Forecast – Move Over $3.00 Means Weather Market Has Started
