
 Yahoo Finance
 Crude Oil Price Update – Closing Price Reversal Top Forming After Testing Major Retracement Zone
U.S. West Texas Intermediate crude oil futures are trading lower late Tuesday after hitting a new high for the year earlier in the session. The early rally was fueled by the cancellation of a meeting between OPEC and its allies in April. This move suggested the OPEC-led production cuts would likely continue into June.
At 19:18 GMT, May WTI crude oil futures are trading $59.24, down $0.14 or -0.24%.
Traders are expressing some concern that the cancellation of the meeting was related to tension between Saudi Arabia and Russia over the pace of the latter’s adherence to the OPEC-led group’s strategy to trim at least 1.2 million barrels from daily production.
Daily Swing Chart Technical Analysis
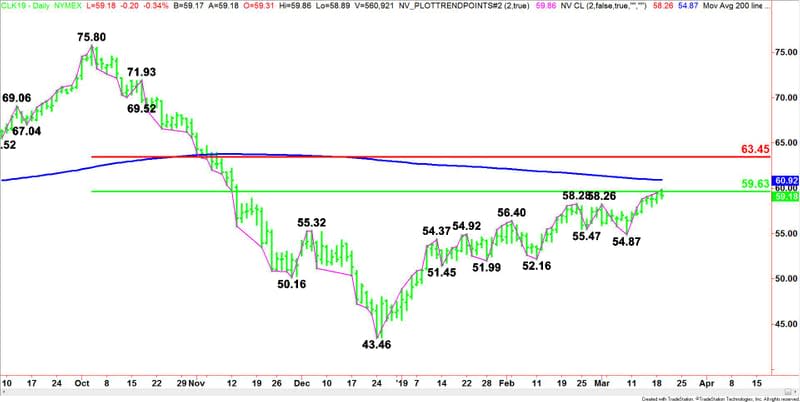
The main trend is up according to the daily swing chart. The uptrend was reaffirmed earlier today when buyers took out yesterday’s high. A trade through $54.87 will change the main trend to down. This is not likely, however, turning lower late in the session indicates the selling may be greater than the buying. Furthermore, it puts crude oil in a position to post a potentially bearish closing price reversal top.
The main range is $75.80 to $43.46. Its retracement zone at $59.63 to $63.45 is the primary upside target. This zone was tested today when buyers overtook the 50% level at $59.63. This zone is very important because it is controlling the longer-term direction of the market.
Daily Swing Chart Technical Forecast
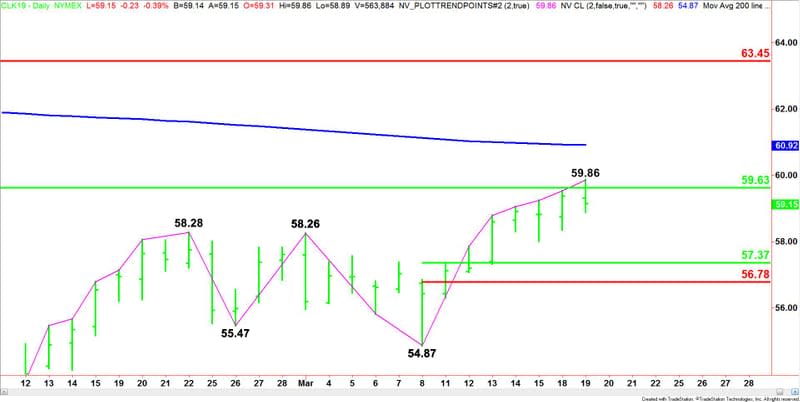
Tuesday’s reaction to a test of the major 50% level at $59.63 was expected because the retracement zone at $59.63 to $63.45 is expected to be the battle ground between the bulls and the bears. This is essentially the “Balance Zone” where the buyers meet the sellers. Trader reaction to this zone will determine the longer-term direction of the crude oil market.
Furthermore, inside this zone is the highly watched 200-Day Moving Average. This level is $60.92. We’re going to be watching this level carefully if touched because this will tell us a lot about the strength of the buying at current price levels.
Given the earlier price action, a lower close today will produce a potentially bearish closing price reversal top. This could trigger the start of a 2 to 3 day counter-trend break.
This article was originally posted on FX Empire
More From FXEMPIRE:
Bitcoin And Ethereum Daily Price Forecast – Bitcoin Bulls On Another Attempt For Bullish Breakout
GBP/JPY Price Forecast – British pound continues to press resistance
USD/CAD Daily Price Forecast – Canadian Dollar Gained On Weak USD And Positive Crude Oil Price
Gold Price Forecast – Gold markets gapped higher to kick off Tuesday
