
 Yahoo Finance
 Cronos Group Inc.'s (TSE:CRON) Shift From Loss To Profit
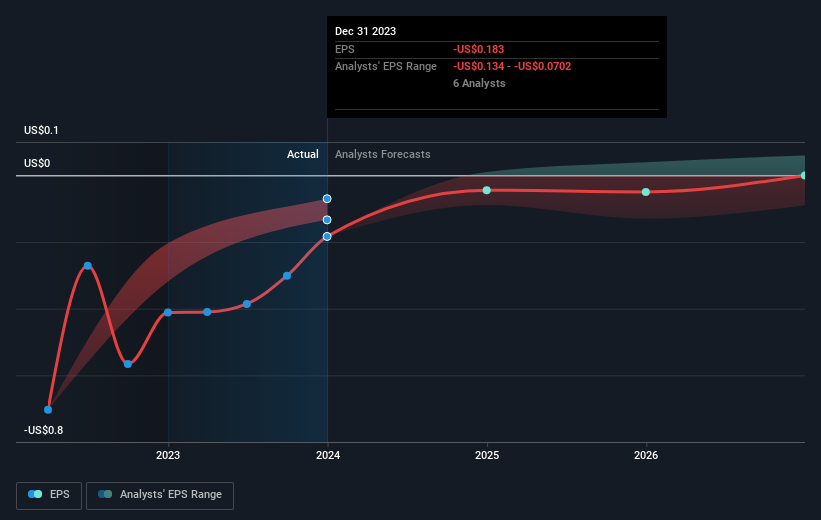
We feel now is a pretty good time to analyse Cronos Group Inc.'s (TSE:CRON) business as it appears the company may be on the cusp of a considerable accomplishment. Cronos Group Inc. operates as a cannabinoid company that engages in the cultivation, production and marketing of cannabis products in Canada, Israel, and Germany. On 31 December 2023, the CA$1.3b market-cap company posted a loss of US$70m for its most recent financial year. Many investors are wondering about the rate at which Cronos Group will turn a profit, with the big question being “when will the company breakeven?” Below we will provide a high-level summary of the industry analysts’ expectations for the company.
View our latest analysis for Cronos Group
Cronos Group is bordering on breakeven, according to the 7 Canadian Pharmaceuticals analysts. They anticipate the company to incur a final loss in 2025, before generating positive profits of US$1.7m in 2026. The company is therefore projected to breakeven around 2 years from today. In order to meet this breakeven date, we calculated the rate at which the company must grow year-on-year. It turns out an average annual growth rate of 62% is expected, which is extremely buoyant. Should the business grow at a slower rate, it will become profitable at a later date than expected.
Underlying developments driving Cronos Group's growth isn’t the focus of this broad overview, however, take into account that generally pharmaceuticals, depending on the stage of product development, have irregular periods of cash flow. This means, large upcoming growth rates are not abnormal as the company is beginning to reap the benefits of earlier investments.
One thing we’d like to point out is that Cronos Group has no debt on its balance sheet, which is quite unusual for a cash-burning pharma, which usually has a high level of debt relative to its equity. This means that the company has been operating purely on its equity investment and has no debt burden. This aspect reduces the risk around investing in the loss-making company.
Next Steps:
This article is not intended to be a comprehensive analysis on Cronos Group, so if you are interested in understanding the company at a deeper level, take a look at Cronos Group's company page on Simply Wall St. We've also compiled a list of pertinent aspects you should further research:
Historical Track Record: What has Cronos Group's performance been like over the past? Go into more detail in the past track record analysis and take a look at the free visual representations of our analysis for more clarity.
Management Team: An experienced management team on the helm increases our confidence in the business – take a look at who sits on Cronos Group's board and the CEO’s background.
Other High-Performing Stocks: Are there other stocks that provide better prospects with proven track records? Explore our free list of these great stocks here.
Have feedback on this article? Concerned about the content? Get in touch with us directly. Alternatively, email editorial-team (at) simplywallst.com.
This article by Simply Wall St is general in nature. We provide commentary based on historical data and analyst forecasts only using an unbiased methodology and our articles are not intended to be financial advice. It does not constitute a recommendation to buy or sell any stock, and does not take account of your objectives, or your financial situation. We aim to bring you long-term focused analysis driven by fundamental data. Note that our analysis may not factor in the latest price-sensitive company announcements or qualitative material. Simply Wall St has no position in any stocks mentioned.
