
 Yahoo Finance
 Is Crew Energy Inc.'s (TSE:CR) CEO Salary Justified?

Dale Shwed became the CEO of Crew Energy Inc. (TSE:CR) in 2003. This report will, first, examine the CEO compensation levels in comparison to CEO compensation at companies of similar size. Next, we'll consider growth that the business demonstrates. Third, we'll reflect on the total return to shareholders over three years, as a second measure of business performance. The aim of all this is to consider the appropriateness of CEO pay levels.
View our latest analysis for Crew Energy
How Does Dale Shwed's Compensation Compare With Similar Sized Companies?
Our data indicates that Crew Energy Inc. is worth CA$79m, and total annual CEO compensation was reported as CA$1.7m for the year to December 2018. We think total compensation is more important but we note that the CEO salary is lower, at CA$410k. Importantly, there may be performance hurdles relating to the non-salary component of the total compensation. We examined a group of similar sized companies, with market capitalizations of below CA$262m. The median CEO total compensation in that group is CA$179k.
As you can see, Dale Shwed is paid more than the median CEO pay at companies of a similar size, in the same market. However, this does not necessarily mean Crew Energy Inc. is paying too much. We can get a better idea of how generous the pay is by looking at the performance of the underlying business.
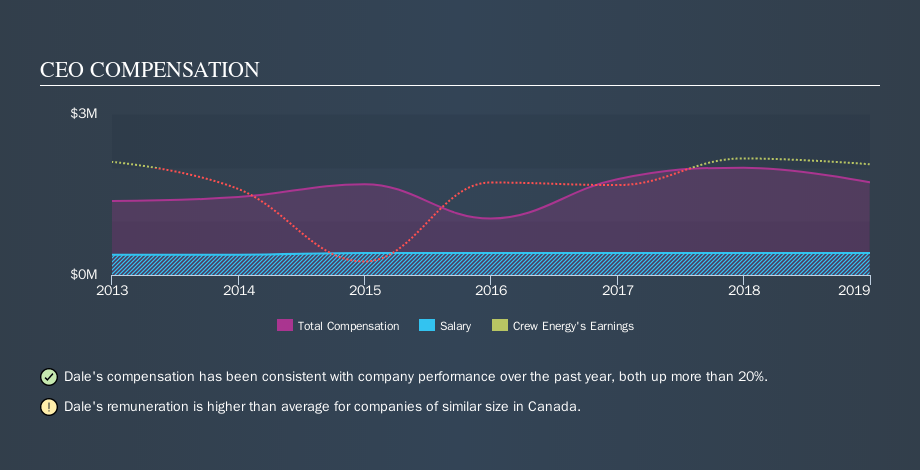
The graphic below shows how CEO compensation at Crew Energy has changed from year to year.
Is Crew Energy Inc. Growing?
Over the last three years Crew Energy Inc. has grown its earnings per share (EPS) by an average of 104% per year (using a line of best fit). Revenue was pretty flat on last year.
This shows that the company has improved itself over the last few years. Good news for shareholders. While it would be good to see revenue growth, profits matter more in the end. You might want to check this free visual report on analyst forecasts for future earnings.
Has Crew Energy Inc. Been A Good Investment?
Given the total loss of 92% over three years, many shareholders in Crew Energy Inc. are probably rather dissatisfied, to say the least. This suggests it would be unwise for the company to pay the CEO too generously.
In Summary...
We compared the total CEO remuneration paid by Crew Energy Inc., and compared it to remuneration at a group of similar sized companies. We found that it pays well over the median amount paid in the benchmark group.
However we must not forget that the EPS growth has been very strong over three years. However, the returns to investors are far less impressive, over the same period. One might thus conclude that it would be better if the company waited until growth is reflected in the share price, before increasing CEO compensation. If you think CEO compensation levels are interesting you will probably really like this free visualization of insider trading at Crew Energy.
Arguably, business quality is much more important than CEO compensation levels. So check out this free list of interesting companies, that have HIGH return on equity and low debt.
We aim to bring you long-term focused research analysis driven by fundamental data. Note that our analysis may not factor in the latest price-sensitive company announcements or qualitative material.
If you spot an error that warrants correction, please contact the editor at editorial-team@simplywallst.com. This article by Simply Wall St is general in nature. It does not constitute a recommendation to buy or sell any stock, and does not take account of your objectives, or your financial situation. Simply Wall St has no position in the stocks mentioned. Thank you for reading.
