
 Yahoo Finance
 Could The Biogen Inc. (NASDAQ:BIIB) Ownership Structure Tell Us Something Useful?

The big shareholder groups in Biogen Inc. (NASDAQ:BIIB) have power over the company. Insiders often own a large chunk of younger, smaller, companies while huge companies tend to have institutions as shareholders. Companies that used to be publicly owned tend to have lower insider ownership.
Biogen is a pretty big company. It has a market capitalization of US$43b. Normally institutions would own a significant portion of a company this size. Our analysis of the ownership of the company, below, shows that institutions are noticeable on the share registry. Let's delve deeper into each type of owner, to discover more about BIIB.
Check out our latest analysis for Biogen
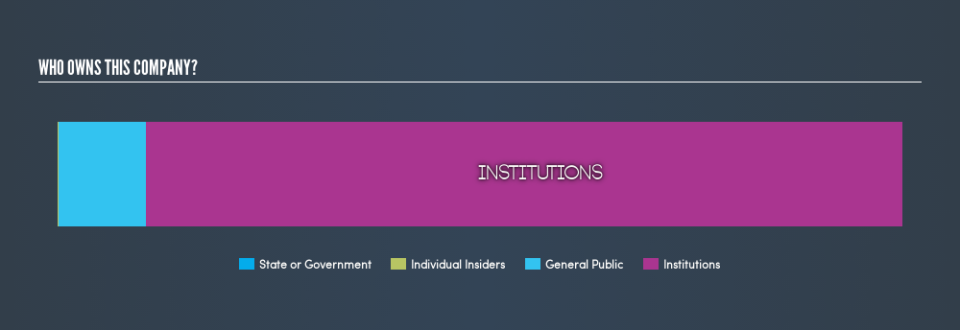
What Does The Institutional Ownership Tell Us About Biogen?
Institutional investors commonly compare their own returns to the returns of a commonly followed index. So they generally do consider buying larger companies that are included in the relevant benchmark index.
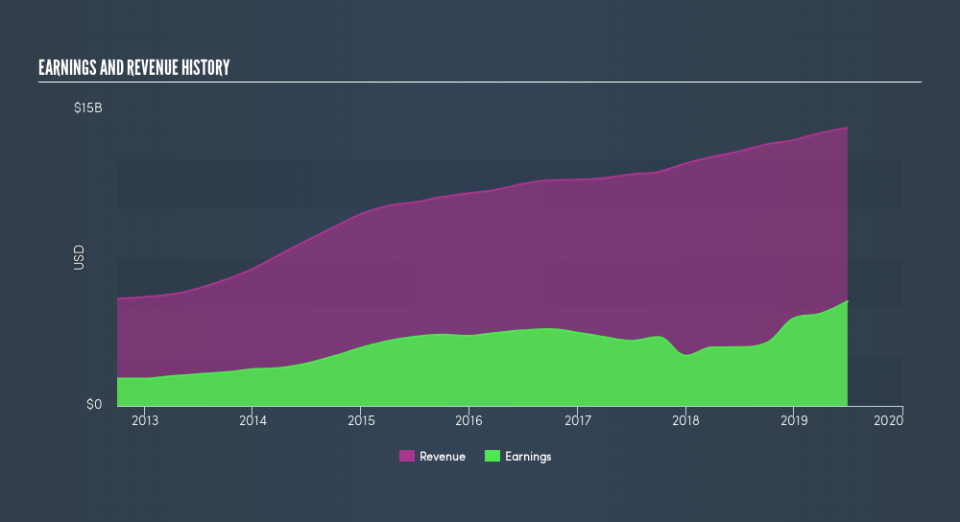
We can see that Biogen does have institutional investors; and they hold 89% of the stock. This implies the analysts working for those institutions have looked at the stock and they like it. But just like anyone else, they could be wrong. When multiple institutions own a stock, there's always a risk that they are in a 'crowded trade'. When such a trade goes wrong, multiple parties may compete to sell stock fast. This risk is higher in a company without a history of growth. You can see Biogen's historic earnings and revenue, below, but keep in mind there's always more to the story.
Since institutional investors own more than half the issued stock, the board will likely have to pay attention to their preferences. Hedge funds don't have many shares in Biogen. Quite a few analysts cover the stock, so you could look into forecast growth quite easily.
Insider Ownership Of Biogen
The definition of company insiders can be subjective, and does vary between jurisdictions. Our data reflects individual insiders, capturing board members at the very least. Company management run the business, but the CEO will answer to the board, even if he or she is a member of it.
I generally consider insider ownership to be a good thing. However, on some occasions it makes it more difficult for other shareholders to hold the board accountable for decisions.
Our data suggests that insiders own under 1% of Biogen Inc. in their own names. As it is a large company, we'd only expect insiders to own a small percentage of it. But it's worth noting that they own US$77m worth of shares. It is good to see board members owning shares, but it might be worth checking if those insiders have been buying.
General Public Ownership
The general public holds a 10% stake in BIIB. While this size of ownership may not be enough to sway a policy decision in their favour, they can still make a collective impact on company policies.
Next Steps:
While it is well worth considering the different groups that own a company, there are other factors that are even more important.
I like to dive deeper into how a company has performed in the past. You can find historic revenue and earnings in this detailed graph.
Ultimately the future is most important. You can access this free report on analyst forecasts for the company.
NB: Figures in this article are calculated using data from the last twelve months, which refer to the 12-month period ending on the last date of the month the financial statement is dated. This may not be consistent with full year annual report figures.
We aim to bring you long-term focused research analysis driven by fundamental data. Note that our analysis may not factor in the latest price-sensitive company announcements or qualitative material.
If you spot an error that warrants correction, please contact the editor at editorial-team@simplywallst.com. This article by Simply Wall St is general in nature. It does not constitute a recommendation to buy or sell any stock, and does not take account of your objectives, or your financial situation. Simply Wall St has no position in the stocks mentioned. Thank you for reading.