
 Yahoo Finance
 Could The Aimia Inc. (TSE:AIM) Ownership Structure Tell Us Something Useful?

Every investor in Aimia Inc. (TSE:AIM) should be aware of the most powerful shareholder groups. Generally speaking, as a company grows, institutions will increase their ownership. Conversely, insiders often decrease their ownership over time. Companies that have been privatized tend to have low insider ownership.
Aimia is a smaller company with a market capitalization of CA$353m, so it may still be flying under the radar of many institutional investors. Our analysis of the ownership of the company, below, shows that institutions own shares in the company. Let's take a closer look to see what the different types of shareholder can tell us about AIM.
See our latest analysis for Aimia
What Does The Institutional Ownership Tell Us About Aimia?
Institutional investors commonly compare their own returns to the returns of a commonly followed index. So they generally do consider buying larger companies that are included in the relevant benchmark index.
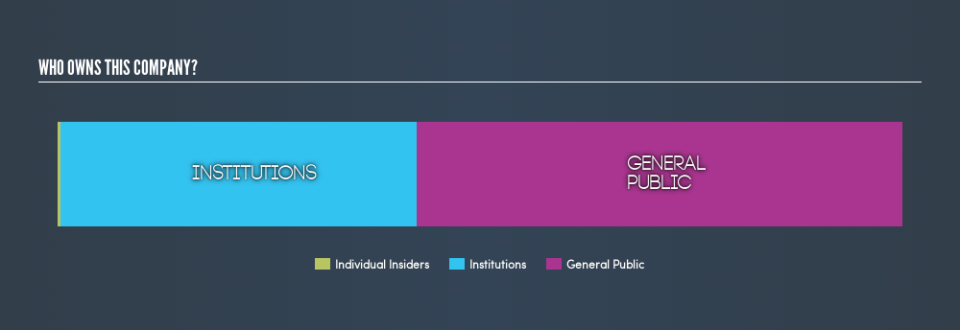
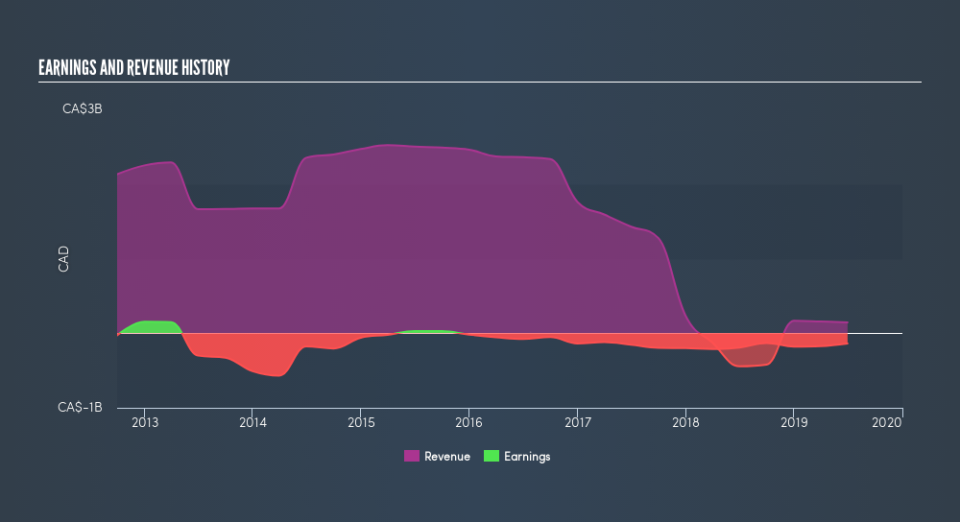
Aimia already has institutions on the share registry. Indeed, they own 42% of the company. This implies the analysts working for those institutions have looked at the stock and they like it. But just like anyone else, they could be wrong. If multiple institutions change their view on a stock at the same time, you could see the share price drop fast. It's therefore worth looking at Aimia's earnings history, below. Of course, the future is what really matters.
Aimia is not owned by hedge funds. There are a reasonable number of analysts covering the stock, so it might be useful to find out their aggregate view on the future.
Insider Ownership Of Aimia
While the precise definition of an insider can be subjective, almost everyone considers board members to be insiders. Company management run the business, but the CEO will answer to the board, even if he or she is a member of it.
Most consider insider ownership a positive because it can indicate the board is well aligned with other shareholders. However, on some occasions too much power is concentrated within this group.
Our information suggests that Aimia Inc. insiders own under 1% of the company. It seems the board members have no more than CA$1.5m worth of shares in the CA$353m company. Many investors in smaller companies prefer to see the board more heavily invested. You can click here to see if those insiders have been buying or selling.
General Public Ownership
The general public, mostly retail investors, hold a substantial 57% stake in AIM, suggesting it is a fairly popular stock. This size of ownership gives retail investors collective power. They can and probably do influence decisions on executive compensation, dividend policies and proposed business acquisitions.
Next Steps:
I find it very interesting to look at who exactly owns a company. But to truly gain insight, we need to consider other information, too.
Many find it useful to take an in depth look at how a company has performed in the past. You can access this detailed graph of past earnings, revenue and cash flow .
If you are like me, you may want to think about whether this company will grow or shrink. Luckily, you can check this free report showing analyst forecasts for its future.
NB: Figures in this article are calculated using data from the last twelve months, which refer to the 12-month period ending on the last date of the month the financial statement is dated. This may not be consistent with full year annual report figures.
We aim to bring you long-term focused research analysis driven by fundamental data. Note that our analysis may not factor in the latest price-sensitive company announcements or qualitative material.
If you spot an error that warrants correction, please contact the editor at editorial-team@simplywallst.com. This article by Simply Wall St is general in nature. It does not constitute a recommendation to buy or sell any stock, and does not take account of your objectives, or your financial situation. Simply Wall St has no position in the stocks mentioned. Thank you for reading.
