
 Yahoo Finance
 What Is Service Corporation International's (NYSE:SCI) P/E Ratio After Its Share Price Tanked?

To the annoyance of some shareholders, Service Corporation International (NYSE:SCI) shares are down a considerable 33% in the last month. Even longer term holders have taken a real hit with the stock declining 16% in the last year.
All else being equal, a share price drop should make a stock more attractive to potential investors. While the market sentiment towards a stock is very changeable, in the long run, the share price will tend to move in the same direction as earnings per share. The implication here is that long term investors have an opportunity when expectations of a company are too low. One way to gauge market expectations of a stock is to look at its Price to Earnings Ratio (PE Ratio). A high P/E ratio means that investors have a high expectation about future growth, while a low P/E ratio means they have low expectations about future growth.
View our latest analysis for Service Corporation International
Does Service Corporation International Have A Relatively High Or Low P/E For Its Industry?
Service Corporation International's P/E of 17.12 indicates relatively low sentiment towards the stock. If you look at the image below, you can see Service Corporation International has a lower P/E than the average (25.3) in the consumer services industry classification.
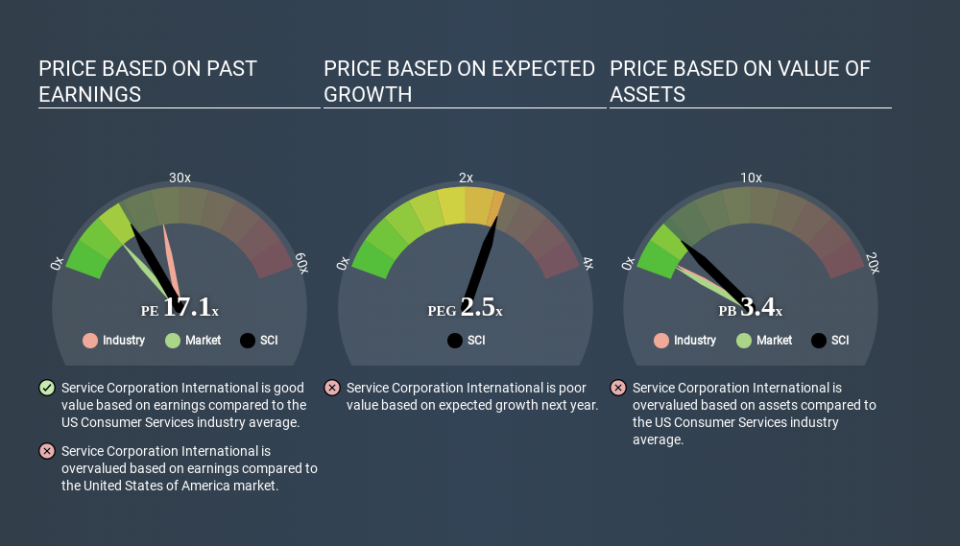
Its relatively low P/E ratio indicates that Service Corporation International shareholders think it will struggle to do as well as other companies in its industry classification. Many investors like to buy stocks when the market is pessimistic about their prospects. It is arguably worth checking if insiders are buying shares, because that might imply they believe the stock is undervalued.
How Growth Rates Impact P/E Ratios
P/E ratios primarily reflect market expectations around earnings growth rates. When earnings grow, the 'E' increases, over time. And in that case, the P/E ratio itself will drop rather quickly. A lower P/E should indicate the stock is cheap relative to others -- and that may attract buyers.
Service Corporation International saw earnings per share decrease by 17% last year. But EPS is up 20% over the last 5 years.
Don't Forget: The P/E Does Not Account For Debt or Bank Deposits
Don't forget that the P/E ratio considers market capitalization. Thus, the metric does not reflect cash or debt held by the company. Theoretically, a business can improve its earnings (and produce a lower P/E in the future) by investing in growth. That means taking on debt (or spending its cash).
Spending on growth might be good or bad a few years later, but the point is that the P/E ratio does not account for the option (or lack thereof).
Service Corporation International's Balance Sheet
Service Corporation International's net debt is 51% of its market cap. This is a reasonably significant level of debt -- all else being equal you'd expect a much lower P/E than if it had net cash.
The Bottom Line On Service Corporation International's P/E Ratio
Service Corporation International trades on a P/E ratio of 17.1, which is above its market average of 12.2. With meaningful debt and a lack of recent earnings growth, the market has high expectations that the business will earn more in the future. Given Service Corporation International's P/E ratio has declined from 25.4 to 17.1 in the last month, we know for sure that the market is significantly less confident about the business today, than it was back then. For those who prefer to invest with the flow of momentum, that might be a bad sign, but for a contrarian, it may signal opportunity.
Investors should be looking to buy stocks that the market is wrong about. If the reality for a company is better than it expects, you can make money by buying and holding for the long term. So this free visual report on analyst forecasts could hold the key to an excellent investment decision.
You might be able to find a better buy than Service Corporation International. If you want a selection of possible winners, check out this free list of interesting companies that trade on a P/E below 20 (but have proven they can grow earnings).
If you spot an error that warrants correction, please contact the editor at editorial-team@simplywallst.com. This article by Simply Wall St is general in nature. It does not constitute a recommendation to buy or sell any stock, and does not take account of your objectives, or your financial situation. Simply Wall St has no position in the stocks mentioned.
We aim to bring you long-term focused research analysis driven by fundamental data. Note that our analysis may not factor in the latest price-sensitive company announcements or qualitative material. Thank you for reading.
