
 Yahoo Finance
 Corning (GLW) Q4 Earnings & Revenues Beat, 2021 View Bullish

Corning Incorporated GLW reported solid fourth-quarter 2020 results, wherein the top and the bottom lines beat the respective Zacks Consensus Estimate.
Strong execution across the company’s portfolio drove growth in all segments. Corning is focused on operational excellence, cash flow generation and capital allocation. It expects the momentum across all businesses to continue in 2021.
Net Income
On a GAAP basis, net income in the quarter was $252 million or 28 cents per share compared with $32 million or 1 cent per share a year ago. The improvement was primarily driven by higher operating income.
In 2020, net income was $512 million or 54 cents per share compared with $960 million or $1.07 per share in 2019.
Quarterly core net income came in at $462 million or 52 cents per share compared with $406 million or 46 cents per share in the prior-year quarter. The bottom line beat the Zacks Consensus Estimate by 4 cents, delivering a positive surprise of 8.3%.
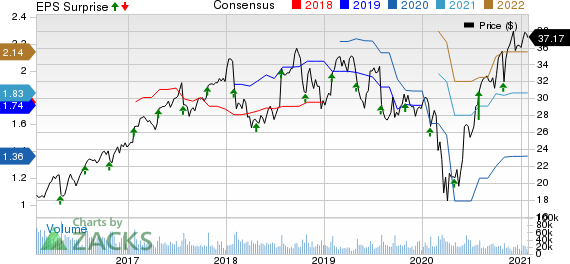
Corning Incorporated Price, Consensus and EPS Surprise
Corning Incorporated price-consensus-eps-surprise-chart | Corning Incorporated Quote
Revenues
Quarterly GAAP net sales increased 18.9% year over year to $3,350 million, as each of the company’s businesses’ sales grew. In 2020, net sales slipped 1.7% to $11,303 million.
Quarterly core sales grew to $3,328 million from $2,851 million in the year-ago quarter. The top line surpassed the consensus estimate of $3,216 million.
Quarterly Segment Results
Net sales in Optical Communications increased 8.1% year over year to $976 million, driven by strength in carrier and enterprise businesses. The segment’s net income was $141 million compared with $62 million in the prior-year quarter.
Net sales in Display Technologies were $841 million compared with $795 million in the prior-year quarter, supported by higher glass volume. The segment’s net income was $217 million compared with $180 million in the year-ago quarter.
Specialty Materials’ net sales were up 20.3% year over year to $545 million. The upside was driven by strong demand for premium cover materials, strength in the IT market and demand for semiconductor-related materials. The segment’s net income was $136 million compared with $94 million in the prior-year quarter.
Environmental Technologies’ net sales grew 19% year over year to $445 million. This was a result of improving markets and more Corning content. Notably, the greater adoption of gasoline particulate filters and diesel filters to meet regulations in China increased Corning’s total addressable market. The segment’s net income was $93 million compared with $64 million in the prior-year quarter.
Net sales in Life Sciences were up 7% year over year to $274 million. This reflects strong demand for research consumables and bio-production products. The segment’s net income improved to $42 million from $38 million reported a year ago.
Other Details
The quarterly cost of sales increased 8.9% year over year to $2,137 million. Gross profit improved to $1,213 million from $854 million. Core gross profit was $1,283 million compared with $1,054 million recorded in the prior-year quarter, with respective margins of 38.6% and 37%. Operating income was $476 million, up from $147 million.
Cash Flow & Liquidity
In 2020, Corning generated $2,180 million of net cash from operating activities compared with $2,031 million in 2019.
As of Dec 31, 2020, the company had $2,672 million in cash and cash equivalents with $7,838 million of long-term debt compared with the respective tallies of $2,434 million and $7,729 million a year ago.
Q1 Outlook
Corning anticipates year-over-year growth to accelerate in the first quarter of 2021. It expects core sales in the range of $3 billion to $3.2 billion, which compares favorably with $2.5 billion in the first quarter of the prior year. Earnings per share (EPS) are estimated between 40 cents and 44 cents, which is double last year’s first-quarter EPS at the low end of the range.
Zacks Rank & Other Stocks to Consider
Corning currently carries a Zacks Rank #2 (Buy).
Some other top-ranked stocks in the broader industry are Airgain AIRG, Knowles KN and U.S. Cellular USM, each sporting a Zacks Rank #1 (Strong Buy). You can see the complete list of today’s Zacks #1 Rank stocks here.
Airgain delivered a trailing four-quarter positive earnings surprise of 62.5%, on average. The company’s earnings beat the Zacks Consensus Estimate in three of the last four quarters.
Knowles delivered a trailing four-quarter positive earnings surprise of 12.5%, on average.
U.S. Cellular delivered a trailing four-quarter positive earnings surprise of 231.1%, on average.
Just Released: Zacks’ 7 Best Stocks for Today
Experts extracted 7 stocks from the list of 220 Zacks Rank #1 Strong Buys that has beaten the market more than 2X over with a stunning average gain of +24.4% per year.
These 7 were selected because of their superior potential for immediate breakout.
See these time-sensitive tickers now >>
Want the latest recommendations from Zacks Investment Research? Today, you can download 7 Best Stocks for the Next 30 Days. Click to get this free report
Corning Incorporated (GLW) : Free Stock Analysis Report
United States Cellular Corporation (USM) : Free Stock Analysis Report
Knowles Corporation (KN) : Free Stock Analysis Report
Airgain, Inc. (AIRG) : Free Stock Analysis Report
To read this article on Zacks.com click here.
Zacks Investment Research
