
 Yahoo Finance
 CorEnergy Infrastructure Trust (NYSE:CORR) shareholders are up 16% this past week, but still in the red over the last three years
CorEnergy Infrastructure Trust, Inc. (NYSE:CORR) shareholders should be happy to see the share price up 16% in the last week. But that doesn't change the fact that the returns over the last three years have been stomach churning. In that time the share price has melted like a snowball in the desert, down 90%. So we're relieved for long term holders to see a bit of uplift. But the more important question is whether the underlying business can justify a higher price still. We really feel for shareholders in this scenario. It's a good reminder of the importance of diversification, and it's worth keeping in mind there's more to life than money, anyway.
While the last three years has been tough for CorEnergy Infrastructure Trust shareholders, this past week has shown signs of promise. So let's look at the longer term fundamentals and see if they've been the driver of the negative returns.
See our latest analysis for CorEnergy Infrastructure Trust
While the efficient markets hypothesis continues to be taught by some, it has been proven that markets are over-reactive dynamic systems, and investors are not always rational. One way to examine how market sentiment has changed over time is to look at the interaction between a company's share price and its earnings per share (EPS).
CorEnergy Infrastructure Trust has made a profit in the past. On the other hand, it reported a trailing twelve months loss, suggesting it isn't reliably profitable. Other metrics may better explain the share price move.
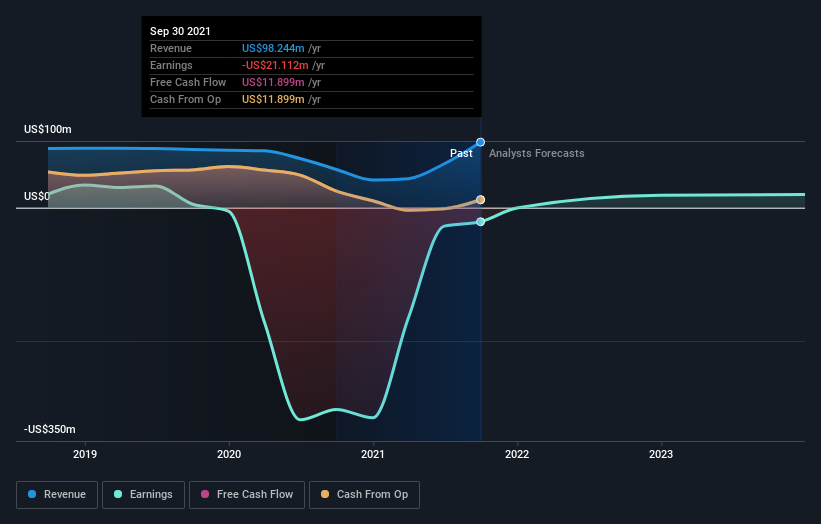
We note that the dividend has declined - a likely contributor to the share price drop. The revenue decline, at an annual rate of 13% over three years, might be considered salt in the wound.
The graphic below depicts how earnings and revenue have changed over time (unveil the exact values by clicking on the image).
If you are thinking of buying or selling CorEnergy Infrastructure Trust stock, you should check out this FREE detailed report on its balance sheet.
A Different Perspective
CorEnergy Infrastructure Trust shareholders are down 59% for the year (even including dividends), but the market itself is up 5.7%. However, keep in mind that even the best stocks will sometimes underperform the market over a twelve month period. Unfortunately, last year's performance may indicate unresolved challenges, given that it was worse than the annualised loss of 13% over the last half decade. Generally speaking long term share price weakness can be a bad sign, though contrarian investors might want to research the stock in hope of a turnaround. I find it very interesting to look at share price over the long term as a proxy for business performance. But to truly gain insight, we need to consider other information, too. Case in point: We've spotted 4 warning signs for CorEnergy Infrastructure Trust you should be aware of.
Of course, you might find a fantastic investment by looking elsewhere. So take a peek at this free list of companies we expect will grow earnings.
Please note, the market returns quoted in this article reflect the market weighted average returns of stocks that currently trade on US exchanges.
Have feedback on this article? Concerned about the content? Get in touch with us directly. Alternatively, email editorial-team (at) simplywallst.com.
This article by Simply Wall St is general in nature. We provide commentary based on historical data and analyst forecasts only using an unbiased methodology and our articles are not intended to be financial advice. It does not constitute a recommendation to buy or sell any stock, and does not take account of your objectives, or your financial situation. We aim to bring you long-term focused analysis driven by fundamental data. Note that our analysis may not factor in the latest price-sensitive company announcements or qualitative material. Simply Wall St has no position in any stocks mentioned.