
 Yahoo Finance
 Concord Acquisition Corp III (NYSE:CNDB) is largely controlled by institutional shareholders who own 56% of the company
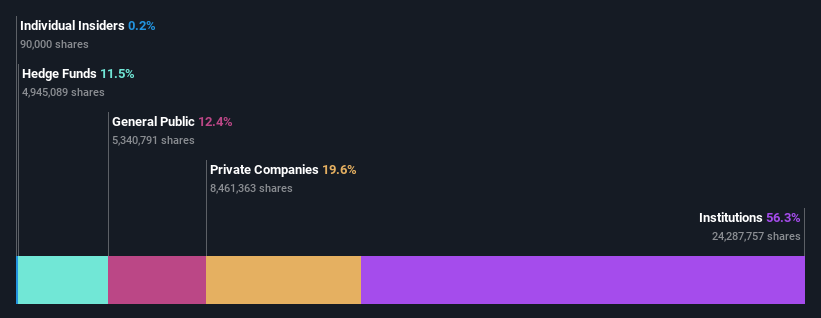
If you want to know who really controls Concord Acquisition Corp III (NYSE:CNDB), then you'll have to look at the makeup of its share registry. We can see that institutions own the lion's share in the company with 56% ownership. That is, the group stands to benefit the most if the stock rises (or lose the most if there is a downturn).
Because institutional owners have a huge pool of resources and liquidity, their investing decisions tend to carry a great deal of weight, especially with individual investors. Therefore, a good portion of institutional money invested in the company is usually a huge vote of confidence on its future.
In the chart below, we zoom in on the different ownership groups of Concord Acquisition Corp III.
View our latest analysis for Concord Acquisition Corp III
What Does The Institutional Ownership Tell Us About Concord Acquisition Corp III?
Institutional investors commonly compare their own returns to the returns of a commonly followed index. So they generally do consider buying larger companies that are included in the relevant benchmark index.
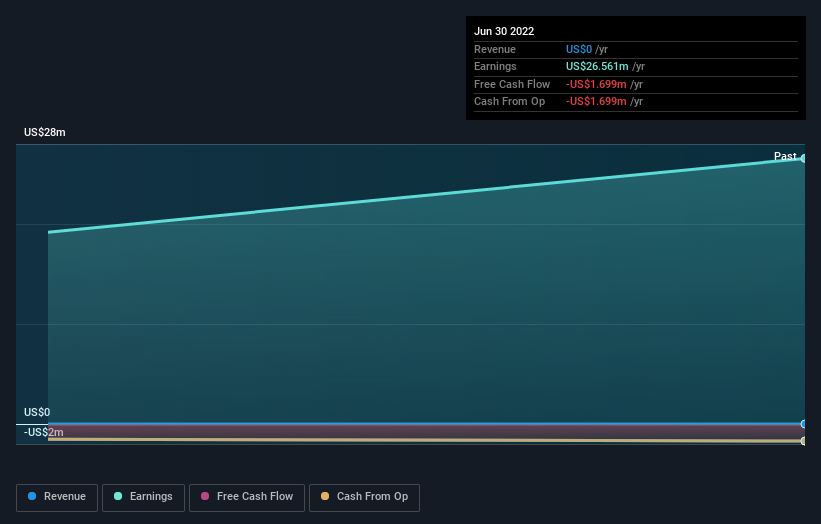
Concord Acquisition Corp III already has institutions on the share registry. Indeed, they own a respectable stake in the company. This implies the analysts working for those institutions have looked at the stock and they like it. But just like anyone else, they could be wrong. When multiple institutions own a stock, there's always a risk that they are in a 'crowded trade'. When such a trade goes wrong, multiple parties may compete to sell stock fast. This risk is higher in a company without a history of growth. You can see Concord Acquisition Corp III's historic earnings and revenue below, but keep in mind there's always more to the story.
Institutional investors own over 50% of the company, so together than can probably strongly influence board decisions. Our data indicates that hedge funds own 11% of Concord Acquisition Corp III. That catches my attention because hedge funds sometimes try to influence management, or bring about changes that will create near term value for shareholders. Concord Sponsor Group III LLC is currently the company's largest shareholder with 18% of shares outstanding. The second and third largest shareholders are 683 Capital Management, LLC and Saba Capital Management, L.P., with an equal amount of shares to their name at 5.7%.
A closer look at our ownership figures suggests that the top 12 shareholders have a combined ownership of 51% implying that no single shareholder has a majority.
While it makes sense to study institutional ownership data for a company, it also makes sense to study analyst sentiments to know which way the wind is blowing. As far as we can tell there isn't analyst coverage of the company, so it is probably flying under the radar.
Insider Ownership Of Concord Acquisition Corp III
The definition of an insider can differ slightly between different countries, but members of the board of directors always count. Company management run the business, but the CEO will answer to the board, even if he or she is a member of it.
Insider ownership is positive when it signals leadership are thinking like the true owners of the company. However, high insider ownership can also give immense power to a small group within the company. This can be negative in some circumstances.
Our data suggests that insiders own under 1% of Concord Acquisition Corp III in their own names. We do note, however, it is possible insiders have an indirect interest through a private company or other corporate structure. It appears that the board holds about US$897k worth of stock. This compares to a market capitalization of US$430m. Many tend to prefer to see a board with bigger shareholdings. A good next step might be to take a look at this free summary of insider buying and selling.
General Public Ownership
With a 12% ownership, the general public, mostly comprising of individual investors, have some degree of sway over Concord Acquisition Corp III. While this size of ownership may not be enough to sway a policy decision in their favour, they can still make a collective impact on company policies.
Private Company Ownership
Our data indicates that Private Companies hold 20%, of the company's shares. It might be worth looking deeper into this. If related parties, such as insiders, have an interest in one of these private companies, that should be disclosed in the annual report. Private companies may also have a strategic interest in the company.
Next Steps:
I find it very interesting to look at who exactly owns a company. But to truly gain insight, we need to consider other information, too. For example, we've discovered 4 warning signs for Concord Acquisition Corp III (3 are a bit concerning!) that you should be aware of before investing here.
If you would prefer check out another company -- one with potentially superior financials -- then do not miss this free list of interesting companies, backed by strong financial data.
NB: Figures in this article are calculated using data from the last twelve months, which refer to the 12-month period ending on the last date of the month the financial statement is dated. This may not be consistent with full year annual report figures.
Have feedback on this article? Concerned about the content? Get in touch with us directly. Alternatively, email editorial-team (at) simplywallst.com.
This article by Simply Wall St is general in nature. We provide commentary based on historical data and analyst forecasts only using an unbiased methodology and our articles are not intended to be financial advice. It does not constitute a recommendation to buy or sell any stock, and does not take account of your objectives, or your financial situation. We aim to bring you long-term focused analysis driven by fundamental data. Note that our analysis may not factor in the latest price-sensitive company announcements or qualitative material. Simply Wall St has no position in any stocks mentioned.
Join A Paid User Research Session
You’ll receive a US$30 Amazon Gift card for 1 hour of your time while helping us build better investing tools for the individual investors like yourself. Sign up here
