
 Yahoo Finance
 Should You Be Concerned About VirtualArmour International Inc.'s (FRA:3V3) Historical Volatility?

Anyone researching VirtualArmour International Inc. (FRA:3V3) might want to consider the historical volatility of the share price. Volatility is considered to be a measure of risk in modern finance theory. Investors may think of volatility as falling into two main categories. The first category is company specific volatility. This can be dealt with by limiting your exposure to any particular stock. The second type is the broader market volatility, which you cannot diversify away, since it arises from macroeconomic factors which directly affects all the stocks on the market.
Some stocks see their prices move in concert with the market. Others tend towards stronger, gentler or unrelated price movements. Beta can be a useful tool to understand how much a stock is influenced by market risk (volatility). However, Warren Buffett said 'volatility is far from synonymous with risk' in his 2014 letter to investors. So, while useful, beta is not the only metric to consider. To use beta as an investor, you must first understand that the overall market has a beta of one. A stock with a beta greater than one is more sensitive to broader market movements than a stock with a beta of less than one.
Want to participate in a short research study? Help shape the future of investing tools and you could win a $250 gift card!
Check out our latest analysis for VirtualArmour International
What 3V3's beta value tells investors
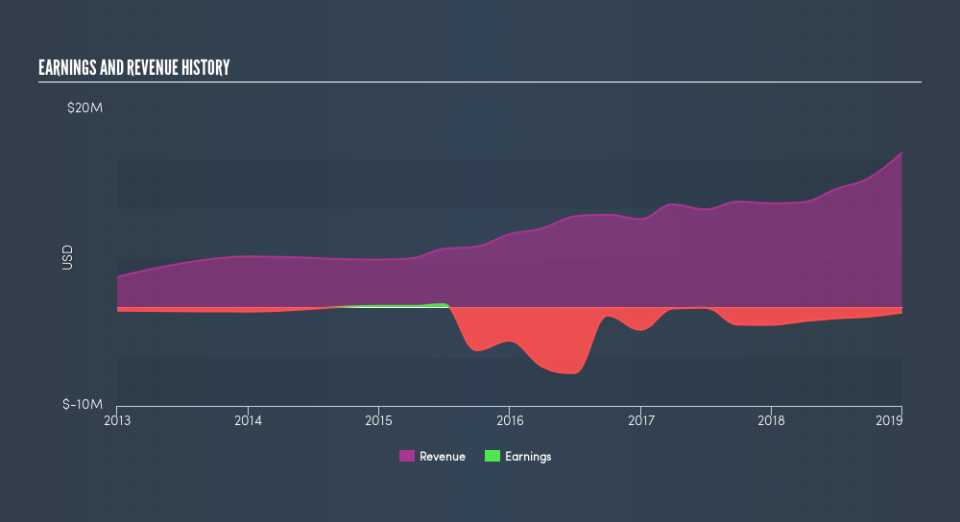
Zooming in on VirtualArmour International, we see it has a five year beta of 1.56. This is above 1, so historically its share price has been influenced by the broader volatility of the stock market. If the past is any guide, we would expect that VirtualArmour International shares will rise quicker than the markets in times of optimism, but fall faster in times of pessimism. Many would argue that beta is useful in position sizing, but fundamental metrics such as revenue and earnings are more important overall. You can see VirtualArmour International's revenue and earnings in the image below.
Does 3V3's size influence the expected beta?
VirtualArmour International is a noticeably small company, with a market capitalisation of €8.8m. Most companies this size are not always actively traded. Relatively few investors can influence the price of a smaller company, compared to a large company. This could explain the high beta value, in this case.
What this means for you:
Since VirtualArmour International tends to moves up when the market is going up, and down when it's going down, potential investors may wish to reflect on the overall market, when considering the stock. This article aims to educate investors about beta values, but it's well worth looking at important company-specific fundamentals such as VirtualArmour International’s financial health and performance track record. I highly recommend you dive deeper by considering the following:
Financial Health: Are 3V3’s operations financially sustainable? Balance sheets can be hard to analyze, which is why we’ve done it for you. Check out our financial health checks here.
Past Track Record: Has 3V3 been consistently performing well irrespective of the ups and downs in the market? Go into more detail in the past performance analysis and take a look at the free visual representations of 3V3's historicals for more clarity.
Other High-Performing Stocks: Are there other stocks that provide better prospects with proven track records? Explore our free list of these great stocks here.
We aim to bring you long-term focused research analysis driven by fundamental data. Note that our analysis may not factor in the latest price-sensitive company announcements or qualitative material.
If you spot an error that warrants correction, please contact the editor at editorial-team@simplywallst.com. This article by Simply Wall St is general in nature. It does not constitute a recommendation to buy or sell any stock, and does not take account of your objectives, or your financial situation. Simply Wall St has no position in the stocks mentioned. Thank you for reading.
