
 Yahoo Finance
 Should You Be Concerned About Canadian Imperial Bank of Commerce’s (TSE:CM) Risks?

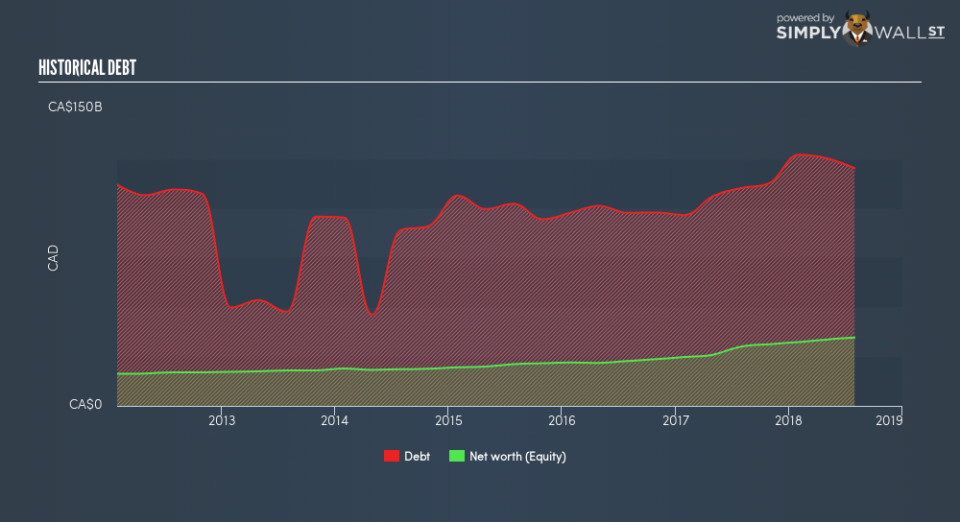
Post-GFC recovery has strengthened economic growth and credit quality, benefiting large banks such as Canadian Imperial Bank of Commerce (TSE:CM), with a market capitalisation of CA$50.8b. A borrower’s demand for, and ability to repay, loans is driven by economic growth which directly impacts the level of risk Canadian Imperial Bank of Commerce takes on. With stricter regulations as a result of the GFC, banks are more conservative in their lending practices, leading to more prudent levels of risky assets on the balance sheet. The level of risky assets a bank holds on its accounts affects the attractiveness of the company as an investment. So today we will focus on three important metrics that are insightful proxies for risk.
Check out our latest analysis for Canadian Imperial Bank of Commerce
How Much Risk Is Too Much?
Canadian Imperial Bank of Commerce is considered to be in a good financial shape if it does not engage in overly risky lending practices. So what constitutes as overly risky? Generally, loans that are “bad” and cannot be recovered by the bank should make up less than 3% of its total loans. When these loans are not repaid, they are written off as expenses which comes out directly from Canadian Imperial Bank of Commerce’s profit. The bank’s bad debt only makes up a very small 0.45% to total debt which means means the bank has very strict bad debt management and faces insignificant levels of default.
How Good Is Canadian Imperial Bank of Commerce At Forecasting Its Risks?
Canadian Imperial Bank of Commerce’s ability to forecast and provision for its bad loans relatively accurately indicates it has a good understanding of the level of risk it is taking on. The bank has poorly anticipated the factors contributing to higher bad loan levels if it writes off more than 100% of the bad debt it provisioned for. This begs the question – does Canadian Imperial Bank of Commerce understand the risks it has taken on? With a bad loan to bad debt ratio of 99.33%, Canadian Imperial Bank of Commerce has under-provisioned by -0.67% which is below the sensible margin of error, illustrating room for improvement in the bank’s forecasting methodology.
Is There Enough Safe Form Of Borrowing?

Canadian Imperial Bank of Commerce makes money by lending out its various forms of borrowings. Deposits from customers tend to bear the lowest risk given the relatively stable amount available and interest rate. The general rule is the higher level of deposits a bank holds, the less risky it is considered to be. Canadian Imperial Bank of Commerce’s total deposit level of 74% of its total liabilities is within the sensible margin for for financial institutions which generally has a ratio of 50%. This indicates a prudent level of the bank’s safer form of borrowing and a prudent level of risk.
Next Steps:
The recent acquisition is expected to bring more opportunities for CM, which in turn should lead to stronger growth. I would stay up-to-date on how this decision will affect the future of the business in terms of earnings growth and financial health. I’ve bookmarked CM’s company page on Simply Wall St to stay informed with changes in outlook and valuation. This is also the source of data for this article. The three main sections I’d recommend you check out are:
Future Outlook: What are well-informed industry analysts predicting for CM’s future growth? Take a look at our free research report of analyst consensus for CM’s outlook.
Valuation: What is CM worth today? Has the future growth potential already been factored into the price? The intrinsic value infographic in our free research report helps visualize whether CM is currently mispriced by the market.
Other High-Performing Stocks: Are there other stocks that provide better prospects with proven track records? Explore our free list of these great stocks here.
To help readers see past the short term volatility of the financial market, we aim to bring you a long-term focused research analysis purely driven by fundamental data. Note that our analysis does not factor in the latest price-sensitive company announcements.
The author is an independent contributor and at the time of publication had no position in the stocks mentioned. For errors that warrant correction please contact the editor at editorial-team@simplywallst.com.
