
 Yahoo Finance
 Computer Modelling Group (TSE:CMG) Is Reinvesting At Lower Rates Of Return
Finding a business that has the potential to grow substantially is not easy, but it is possible if we look at a few key financial metrics. Firstly, we'd want to identify a growing return on capital employed (ROCE) and then alongside that, an ever-increasing base of capital employed. This shows us that it's a compounding machine, able to continually reinvest its earnings back into the business and generate higher returns. So while Computer Modelling Group (TSE:CMG) has a high ROCE right now, lets see what we can decipher from how returns are changing.
Return On Capital Employed (ROCE): What is it?
Just to clarify if you're unsure, ROCE is a metric for evaluating how much pre-tax income (in percentage terms) a company earns on the capital invested in its business. Analysts use this formula to calculate it for Computer Modelling Group:
Return on Capital Employed = Earnings Before Interest and Tax (EBIT) ÷ (Total Assets - Current Liabilities)
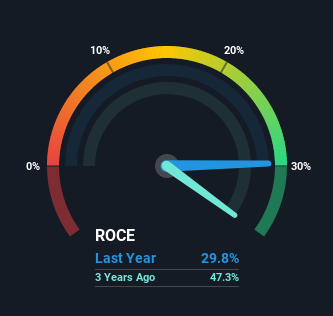
0.30 = CA$25m ÷ (CA$113m - CA$29m) (Based on the trailing twelve months to June 2021).
So, Computer Modelling Group has an ROCE of 30%. That's a fantastic return and not only that, it outpaces the average of 5.0% earned by companies in a similar industry.
Check out our latest analysis for Computer Modelling Group
In the above chart we have measured Computer Modelling Group's prior ROCE against its prior performance, but the future is arguably more important. If you'd like to see what analysts are forecasting going forward, you should check out our free report for Computer Modelling Group.
What Does the ROCE Trend For Computer Modelling Group Tell Us?
On the surface, the trend of ROCE at Computer Modelling Group doesn't inspire confidence. To be more specific, while the ROCE is still high, it's fallen from 58% where it was five years ago. Given the business is employing more capital while revenue has slipped, this is a bit concerning. If this were to continue, you might be looking at a company that is trying to reinvest for growth but is actually losing market share since sales haven't increased.
The Bottom Line
From the above analysis, we find it rather worrisome that returns on capital and sales for Computer Modelling Group have fallen, meanwhile the business is employing more capital than it was five years ago. It should come as no surprise then that the stock has fallen 21% over the last five years, so it looks like investors are recognizing these changes. Unless there is a shift to a more positive trajectory in these metrics, we would look elsewhere.
One more thing, we've spotted 3 warning signs facing Computer Modelling Group that you might find interesting.
Computer Modelling Group is not the only stock earning high returns. If you'd like to see more, check out our free list of companies earning high returns on equity with solid fundamentals.
This article by Simply Wall St is general in nature. We provide commentary based on historical data and analyst forecasts only using an unbiased methodology and our articles are not intended to be financial advice. It does not constitute a recommendation to buy or sell any stock, and does not take account of your objectives, or your financial situation. We aim to bring you long-term focused analysis driven by fundamental data. Note that our analysis may not factor in the latest price-sensitive company announcements or qualitative material. Simply Wall St has no position in any stocks mentioned.
Have feedback on this article? Concerned about the content? Get in touch with us directly. Alternatively, email editorial-team (at) simplywallst.com.
