
 Yahoo Finance
 Computer Modelling Group Ltd.'s (TSE:CMG) Stock Is Going Strong: Have Financials A Role To Play?
Computer Modelling Group (TSE:CMG) has had a great run on the share market with its stock up by a significant 24% over the last three months. We wonder if and what role the company's financials play in that price change as a company's long-term fundamentals usually dictate market outcomes. Particularly, we will be paying attention to Computer Modelling Group's ROE today.
Return on equity or ROE is an important factor to be considered by a shareholder because it tells them how effectively their capital is being reinvested. In short, ROE shows the profit each dollar generates with respect to its shareholder investments.
View our latest analysis for Computer Modelling Group
How To Calculate Return On Equity?
The formula for return on equity is:
Return on Equity = Net Profit (from continuing operations) ÷ Shareholders' Equity
So, based on the above formula, the ROE for Computer Modelling Group is:
39% = CA$19m ÷ CA$48m (Based on the trailing twelve months to September 2022).
The 'return' is the amount earned after tax over the last twelve months. That means that for every CA$1 worth of shareholders' equity, the company generated CA$0.39 in profit.
Why Is ROE Important For Earnings Growth?
We have already established that ROE serves as an efficient profit-generating gauge for a company's future earnings. Based on how much of its profits the company chooses to reinvest or "retain", we are then able to evaluate a company's future ability to generate profits. Assuming everything else remains unchanged, the higher the ROE and profit retention, the higher the growth rate of a company compared to companies that don't necessarily bear these characteristics.
Computer Modelling Group's Earnings Growth And 39% ROE
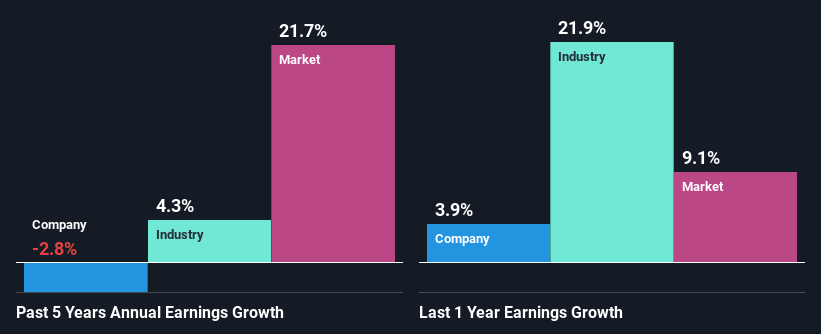
To begin with, Computer Modelling Group has a pretty high ROE which is interesting. Second, a comparison with the average ROE reported by the industry of 11% also doesn't go unnoticed by us. For this reason, Computer Modelling Group's five year net income decline of 2.8% raises the question as to why the high ROE didn't translate into earnings growth. Based on this, we feel that there might be other reasons which haven't been discussed so far in this article that could be hampering the company's growth. Such as, the company pays out a huge portion of its earnings as dividends, or is faced with competitive pressures.
However, when we compared Computer Modelling Group's growth with the industry we found that while the company's earnings have been shrinking, the industry has seen an earnings growth of 4.3% in the same period. This is quite worrisome.
The basis for attaching value to a company is, to a great extent, tied to its earnings growth. What investors need to determine next is if the expected earnings growth, or the lack of it, is already built into the share price. By doing so, they will have an idea if the stock is headed into clear blue waters or if swampy waters await. One good indicator of expected earnings growth is the P/E ratio which determines the price the market is willing to pay for a stock based on its earnings prospects. So, you may want to check if Computer Modelling Group is trading on a high P/E or a low P/E, relative to its industry.
Is Computer Modelling Group Making Efficient Use Of Its Profits?
Computer Modelling Group's declining earnings is not surprising given how the company is spending most of its profits in paying dividends, judging by its three-year median payout ratio of 89% (or a retention ratio of 11%). The business is only left with a small pool of capital to reinvest - A vicious cycle that doesn't benefit the company in the long-run. Our risks dashboard should have the 2 risks we have identified for Computer Modelling Group.
Additionally, Computer Modelling Group has paid dividends over a period of at least ten years, which means that the company's management is determined to pay dividends even if it means little to no earnings growth.
Conclusion
Overall, we feel that Computer Modelling Group certainly does have some positive factors to consider. Although, we are disappointed to see a lack of growth in earnings even in spite of a high ROE. Bear in mind, the company reinvests a small portion of its profits, which means that investors aren't reaping the benefits of the high rate of return. Having said that, looking at current analyst estimates, we found that the company's earnings growth rate is expected to see a huge improvement. To know more about the company's future earnings growth forecasts take a look at this free report on analyst forecasts for the company to find out more.
Have feedback on this article? Concerned about the content? Get in touch with us directly. Alternatively, email editorial-team (at) simplywallst.com.
This article by Simply Wall St is general in nature. We provide commentary based on historical data and analyst forecasts only using an unbiased methodology and our articles are not intended to be financial advice. It does not constitute a recommendation to buy or sell any stock, and does not take account of your objectives, or your financial situation. We aim to bring you long-term focused analysis driven by fundamental data. Note that our analysis may not factor in the latest price-sensitive company announcements or qualitative material. Simply Wall St has no position in any stocks mentioned.
Join A Paid User Research Session
You’ll receive a US$30 Amazon Gift card for 1 hour of your time while helping us build better investing tools for the individual investors like yourself. Sign up here
