
 Yahoo Finance
 CompuGroup Medical SE KGaA (ETR:COP) Is Reinvesting At Lower Rates Of Return
Finding a business that has the potential to grow substantially is not easy, but it is possible if we look at a few key financial metrics. Firstly, we'll want to see a proven return on capital employed (ROCE) that is increasing, and secondly, an expanding base of capital employed. Basically this means that a company has profitable initiatives that it can continue to reinvest in, which is a trait of a compounding machine. Having said that, from a first glance at CompuGroup Medical SE KGaA (ETR:COP) we aren't jumping out of our chairs at how returns are trending, but let's have a deeper look.
Understanding Return On Capital Employed (ROCE)
If you haven't worked with ROCE before, it measures the 'return' (pre-tax profit) a company generates from capital employed in its business. Analysts use this formula to calculate it for CompuGroup Medical SE KGaA:
Return on Capital Employed = Earnings Before Interest and Tax (EBIT) ÷ (Total Assets - Current Liabilities)
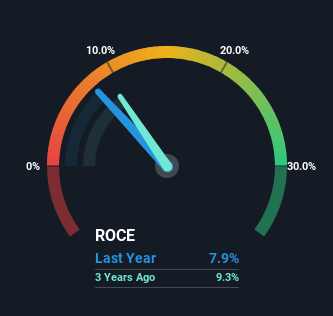
0.079 = €124m ÷ (€2.0b - €432m) (Based on the trailing twelve months to March 2024).
Therefore, CompuGroup Medical SE KGaA has an ROCE of 7.9%. On its own that's a low return on capital but it's in line with the industry's average returns of 7.9%.
See our latest analysis for CompuGroup Medical SE KGaA
Above you can see how the current ROCE for CompuGroup Medical SE KGaA compares to its prior returns on capital, but there's only so much you can tell from the past. If you'd like to see what analysts are forecasting going forward, you should check out our free analyst report for CompuGroup Medical SE KGaA .
What Does the ROCE Trend For CompuGroup Medical SE KGaA Tell Us?
When we looked at the ROCE trend at CompuGroup Medical SE KGaA, we didn't gain much confidence. Over the last five years, returns on capital have decreased to 7.9% from 20% five years ago. On the other hand, the company has been employing more capital without a corresponding improvement in sales in the last year, which could suggest these investments are longer term plays. It may take some time before the company starts to see any change in earnings from these investments.
The Bottom Line
In summary, CompuGroup Medical SE KGaA is reinvesting funds back into the business for growth but unfortunately it looks like sales haven't increased much just yet. And in the last five years, the stock has given away 62% so the market doesn't look too hopeful on these trends strengthening any time soon. All in all, the inherent trends aren't typical of multi-baggers, so if that's what you're after, we think you might have more luck elsewhere.
Like most companies, CompuGroup Medical SE KGaA does come with some risks, and we've found 2 warning signs that you should be aware of.
While CompuGroup Medical SE KGaA isn't earning the highest return, check out this free list of companies that are earning high returns on equity with solid balance sheets.
Have feedback on this article? Concerned about the content? Get in touch with us directly. Alternatively, email editorial-team (at) simplywallst.com.
This article by Simply Wall St is general in nature. We provide commentary based on historical data and analyst forecasts only using an unbiased methodology and our articles are not intended to be financial advice. It does not constitute a recommendation to buy or sell any stock, and does not take account of your objectives, or your financial situation. We aim to bring you long-term focused analysis driven by fundamental data. Note that our analysis may not factor in the latest price-sensitive company announcements or qualitative material. Simply Wall St has no position in any stocks mentioned.
Have feedback on this article? Concerned about the content? Get in touch with us directly. Alternatively, email editorial-team@simplywallst.com
