
 Yahoo Finance
 Composite Alliance Group Inc.'s (CVE:CAG) Share Price Is Matching Sentiment Around Its Revenues
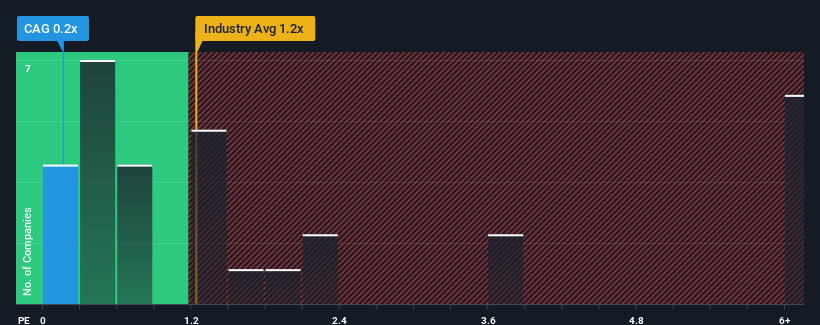
When you see that almost half of the companies in the Machinery industry in Canada have price-to-sales ratios (or "P/S") above 1.2x, Composite Alliance Group Inc. (CVE:CAG) looks to be giving off some buy signals with its 0.2x P/S ratio. Nonetheless, we'd need to dig a little deeper to determine if there is a rational basis for the reduced P/S.
Check out our latest analysis for Composite Alliance Group
How Has Composite Alliance Group Performed Recently?
Composite Alliance Group certainly has been doing a great job lately as it's been growing its revenue at a really rapid pace. Perhaps the market is expecting future revenue performance to dwindle, which has kept the P/S suppressed. If that doesn't eventuate, then existing shareholders have reason to be quite optimistic about the future direction of the share price.
We don't have analyst forecasts, but you can see how recent trends are setting up the company for the future by checking out our free report on Composite Alliance Group's earnings, revenue and cash flow.
What Are Revenue Growth Metrics Telling Us About The Low P/S?
In order to justify its P/S ratio, Composite Alliance Group would need to produce sluggish growth that's trailing the industry.
Taking a look back first, we see that the company grew revenue by an impressive 202% last year. The strong recent performance means it was also able to grow revenue by 36% in total over the last three years. Accordingly, shareholders would have definitely welcomed those medium-term rates of revenue growth.
This is in contrast to the rest of the industry, which is expected to grow by 19% over the next year, materially higher than the company's recent medium-term annualised growth rates.
With this in consideration, it's easy to understand why Composite Alliance Group's P/S falls short of the mark set by its industry peers. It seems most investors are expecting to see the recent limited growth rates continue into the future and are only willing to pay a reduced amount for the stock.
The Final Word
Typically, we'd caution against reading too much into price-to-sales ratios when settling on investment decisions, though it can reveal plenty about what other market participants think about the company.
In line with expectations, Composite Alliance Group maintains its low P/S on the weakness of its recent three-year growth being lower than the wider industry forecast. Right now shareholders are accepting the low P/S as they concede future revenue probably won't provide any pleasant surprises. If recent medium-term revenue trends continue, it's hard to see the share price experience a reversal of fortunes anytime soon.
It's always necessary to consider the ever-present spectre of investment risk. We've identified 5 warning signs with Composite Alliance Group (at least 4 which are a bit concerning), and understanding them should be part of your investment process.
If these risks are making you reconsider your opinion on Composite Alliance Group, explore our interactive list of high quality stocks to get an idea of what else is out there.
Have feedback on this article? Concerned about the content? Get in touch with us directly. Alternatively, email editorial-team (at) simplywallst.com.
This article by Simply Wall St is general in nature. We provide commentary based on historical data and analyst forecasts only using an unbiased methodology and our articles are not intended to be financial advice. It does not constitute a recommendation to buy or sell any stock, and does not take account of your objectives, or your financial situation. We aim to bring you long-term focused analysis driven by fundamental data. Note that our analysis may not factor in the latest price-sensitive company announcements or qualitative material. Simply Wall St has no position in any stocks mentioned.
