
 Yahoo Finance
 Is Compass Group PLC's (LON:CPG) Recent Stock Performance Influenced By Its Fundamentals In Any Way?
Compass Group (LON:CPG) has had a great run on the share market with its stock up by a significant 10% over the last month. Given that stock prices are usually aligned with a company's financial performance in the long-term, we decided to study its financial indicators more closely to see if they had a hand to play in the recent price move. In this article, we decided to focus on Compass Group's ROE.
Return on equity or ROE is a key measure used to assess how efficiently a company's management is utilizing the company's capital. In simpler terms, it measures the profitability of a company in relation to shareholder's equity.
Check out our latest analysis for Compass Group
How To Calculate Return On Equity?
ROE can be calculated by using the formula:
Return on Equity = Net Profit (from continuing operations) ÷ Shareholders' Equity
So, based on the above formula, the ROE for Compass Group is:
14% = UK£737m ÷ UK£5.4b (Based on the trailing twelve months to March 2022).
The 'return' is the income the business earned over the last year. One way to conceptualize this is that for each £1 of shareholders' capital it has, the company made £0.14 in profit.
Why Is ROE Important For Earnings Growth?
So far, we've learned that ROE is a measure of a company's profitability. Depending on how much of these profits the company reinvests or "retains", and how effectively it does so, we are then able to assess a company’s earnings growth potential. Assuming everything else remains unchanged, the higher the ROE and profit retention, the higher the growth rate of a company compared to companies that don't necessarily bear these characteristics.
Compass Group's Earnings Growth And 14% ROE
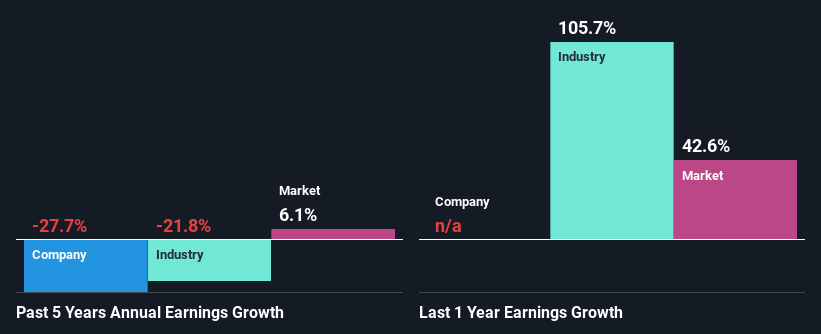
To begin with, Compass Group seems to have a respectable ROE. Especially when compared to the industry average of 9.3% the company's ROE looks pretty impressive. As you might expect, the 28% net income decline reported by Compass Group is a bit of a surprise. Based on this, we feel that there might be other reasons which haven't been discussed so far in this article that could be hampering the company's growth. For example, it could be that the company has a high payout ratio or the business has allocated capital poorly, for instance.
As a next step, we compared Compass Group's performance with the industry and found thatCompass Group's performance is depressing even when compared with the industry, which has shrunk its earnings at a rate of 22% in the same period, which is a slower than the company.
The basis for attaching value to a company is, to a great extent, tied to its earnings growth. What investors need to determine next is if the expected earnings growth, or the lack of it, is already built into the share price. This then helps them determine if the stock is placed for a bright or bleak future. What is CPG worth today? The intrinsic value infographic in our free research report helps visualize whether CPG is currently mispriced by the market.
Is Compass Group Efficiently Re-investing Its Profits?
Compass Group's declining earnings is not surprising given how the company is spending most of its profits in paying dividends, judging by its three-year median payout ratio of 54% (or a retention ratio of 46%). With only a little being reinvested into the business, earnings growth would obviously be low or non-existent.
In addition, Compass Group has been paying dividends over a period of at least ten years suggesting that keeping up dividend payments is way more important to the management even if it comes at the cost of business growth. Upon studying the latest analysts' consensus data, we found that the company is expected to keep paying out approximately 47% of its profits over the next three years. However, Compass Group's ROE is predicted to rise to 23% despite there being no anticipated change in its payout ratio.
Summary
In total, it does look like Compass Group has some positive aspects to its business. Although, we are disappointed to see a lack of growth in earnings even in spite of a high ROE. Bear in mind, the company reinvests a small portion of its profits, which means that investors aren't reaping the benefits of the high rate of return. With that said, we studied the latest analyst forecasts and found that while the company has shrunk its earnings in the past, analysts expect its earnings to grow in the future. Are these analysts expectations based on the broad expectations for the industry, or on the company's fundamentals? Click here to be taken to our analyst's forecasts page for the company.
Have feedback on this article? Concerned about the content? Get in touch with us directly. Alternatively, email editorial-team (at) simplywallst.com.
This article by Simply Wall St is general in nature. We provide commentary based on historical data and analyst forecasts only using an unbiased methodology and our articles are not intended to be financial advice. It does not constitute a recommendation to buy or sell any stock, and does not take account of your objectives, or your financial situation. We aim to bring you long-term focused analysis driven by fundamental data. Note that our analysis may not factor in the latest price-sensitive company announcements or qualitative material. Simply Wall St has no position in any stocks mentioned.
