
 Yahoo Finance
 Community Bank System (NYSE:CBU) Has Gifted Shareholders With A Fantastic 121% Total Return On Their Investment
If you buy and hold a stock for many years, you'd hope to be making a profit. But more than that, you probably want to see it rise more than the market average. Unfortunately for shareholders, while the Community Bank System, Inc. (NYSE:CBU) share price is up 95% in the last five years, that's less than the market return. However, more recent buyers should be happy with the increase of 24% over the last year.
View our latest analysis for Community Bank System
To paraphrase Benjamin Graham: Over the short term the market is a voting machine, but over the long term it's a weighing machine. One flawed but reasonable way to assess how sentiment around a company has changed is to compare the earnings per share (EPS) with the share price.
During five years of share price growth, Community Bank System achieved compound earnings per share (EPS) growth of 8.3% per year. This EPS growth is slower than the share price growth of 14% per year, over the same period. This suggests that market participants hold the company in higher regard, these days. And that's hardly shocking given the track record of growth.
You can see below how EPS has changed over time (discover the exact values by clicking on the image).
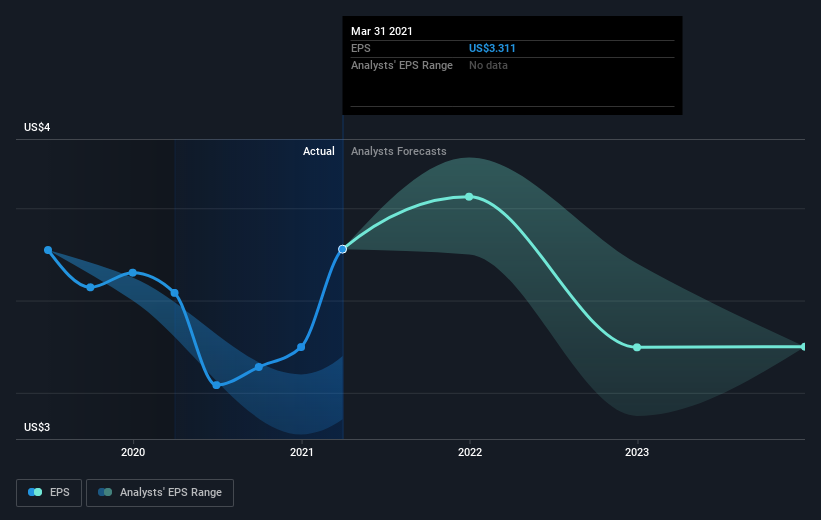
It might be well worthwhile taking a look at our free report on Community Bank System's earnings, revenue and cash flow.
What About Dividends?
When looking at investment returns, it is important to consider the difference between total shareholder return (TSR) and share price return. The TSR incorporates the value of any spin-offs or discounted capital raisings, along with any dividends, based on the assumption that the dividends are reinvested. Arguably, the TSR gives a more comprehensive picture of the return generated by a stock. We note that for Community Bank System the TSR over the last 5 years was 121%, which is better than the share price return mentioned above. This is largely a result of its dividend payments!
A Different Perspective
Community Bank System shareholders are up 28% for the year (even including dividends). Unfortunately this falls short of the market return. On the bright side, that's still a gain, and it's actually better than the average return of 17% over half a decade This suggests the company might be improving over time. It's always interesting to track share price performance over the longer term. But to understand Community Bank System better, we need to consider many other factors. Case in point: We've spotted 2 warning signs for Community Bank System you should be aware of, and 1 of them is concerning.
If you would prefer to check out another company -- one with potentially superior financials -- then do not miss this free list of companies that have proven they can grow earnings.
Please note, the market returns quoted in this article reflect the market weighted average returns of stocks that currently trade on US exchanges.
This article by Simply Wall St is general in nature. It does not constitute a recommendation to buy or sell any stock, and does not take account of your objectives, or your financial situation. We aim to bring you long-term focused analysis driven by fundamental data. Note that our analysis may not factor in the latest price-sensitive company announcements or qualitative material. Simply Wall St has no position in any stocks mentioned.
Have feedback on this article? Concerned about the content? Get in touch with us directly. Alternatively, email editorial-team (at) simplywallst.com.
