
 Yahoo Finance
 Commerce Bancshares (CBSH) Stock Gains on Q1 Earnings Beat
Shares of Commerce Bancshares Inc. CBSH gained 1.5% following the release of first-quarter 2024 results. Quarterly earnings per share of 86 cents surpassed the Zacks Consensus Estimate of 80 cents. However, the bottom line decreased 5.5% from the prior-year quarter.
Results benefited from a rise in non-interest income and lower provisions, which were partially offset by net losses on investment securities. Also, the company recorded a sequential improvement in loan balances in the quarter. However, a decline in net interest income (NII) and higher expenses were the major headwinds.
Net income attributable to common shareholders was $112.7 million, down 5.7% year over year. Our estimate for the metric was $99.9 million.
Revenues Improve but Expenses Rise
Total quarterly revenues were $397.8 million, up 2.2% year over year. The top line also beat the Zacks Consensus Estimate of $385.9 million.
NII was $249 million, down 1%. Our estimate for NII was $242.8 million.
Net yield on interest-earning assets expanded 7 basis points (bps) from the prior-year quarter to 3.33%.
Non-interest income was $148.8 million, up 8.2%. The rise was driven by an increase in almost all fee income components except for consumer brokerage services fees. Our estimate for non-interest income was $139.4 million.
Non-interest expenses increased 9.6% to $245.7 million. The rise was due to an increase in all cost components except marketing expenses. The expenses included a $10 million litigation settlement charge and $4 million related to the adjustment to FDIC special assessment. We had projected expenses to be $237.9 million, which did not include the litigation settlement charge.
Net investment securities recorded a loss of $259 thousand compared to a loss of $306 thousand in the prior-year quarter.
The efficiency ratio increased to 61.67% from 57.49% in the year-ago quarter. A rise in the efficiency ratio indicates a deterioration in profitability.
As of Mar 31, 2024, total loans were $17.3 billion, up marginally from the prior quarter. Total deposits as of the same date were $24.44 billion, down 3.6%. Our estimates for total loans and deposits were $17.1 billion and $24.9 billion, respectively.
Asset Quality Improves
Provision for credit losses was $4.8 million, which decreased 58.2% from the prior-year quarter. Our estimate for the metric was $16.3 million.
Non-accrual loans to total loans were 0.03%, down 3 bps from the prior-year quarter. Allowance for credit losses on loans to total loans was 0.93%, decreasing 3 bps.
On the other hand, the ratio of annualized net loan charge-offs to total average loans was 0.21%, up from 0.17% in the year-earlier quarter.
Capital Ratios Improve, Profitability Ratios Deteriorate
As of Mar 31, 2024, the Tier I leverage ratio was 11.75%, up from 10.61% in the year-ago quarter. Tangible common equity to tangible assets ratio increased to 9.24% from the prior-year quarter’s 7.92%.
At the end of the first quarter, the return on total average assets was 1.48%, down from the year-ago period’s 1.54%. Return on average equity was 15.39% compared with 18.75% in the prior-year quarter.
Share Repurchase Update
During the reported quarter, the company repurchased approximately 0.81 million shares at an average price of $52.13.
Our Take
Commerce Bancshares’ revenues are expected to be driven by decent loan demand and its initiatives to strengthen fee income sources. However, rising expenses remain a near-term headwind.
Commerce Bancshares, Inc. Price, Consensus and EPS Surprise
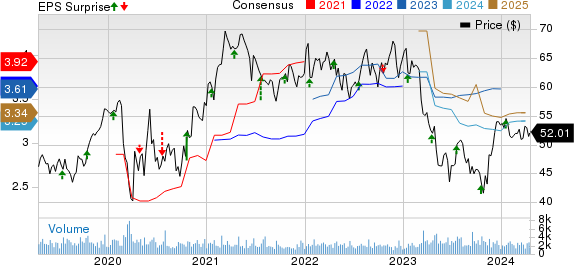
Commerce Bancshares, Inc. price-consensus-eps-surprise-chart | Commerce Bancshares, Inc. Quote
Currently, Commerce Bancshares carries a Zacks Rank #3 (Hold). You can see the complete list of today’s Zacks #1 Rank (Strong Buy) stocks here.
Earnings Release Schedule of Other Banks
Hilltop Holdings Inc. HTH is scheduled to release its first-quarter 2024 results on Apr 18.
Over the past 30 days, the Zacks Consensus Estimate for HTH’s quarterly earnings has remained unchanged at 31 cents. This implies a 30% decrease from the prior year quarter.
WaFd, Inc. WAFD is slated to report its second-quarter fiscal 2024 results on Apr 22.
Over the past 30 days, the Zacks Consensus Estimate for WAFD’s quarterly earnings has moved 34% lower to 31 cents. This indicates a 67.4% decrease from the prior year quarter.
Want the latest recommendations from Zacks Investment Research? Today, you can download 7 Best Stocks for the Next 30 Days. Click to get this free report
Hilltop Holdings Inc. (HTH) : Free Stock Analysis Report
Commerce Bancshares, Inc. (CBSH) : Free Stock Analysis Report
WaFd, Inc. (WAFD) : Free Stock Analysis Report
