
 Yahoo Finance
 Colliers International Group's (TSE:CIGI) investors will be pleased with their favorable 76% return over the last five years
It might be of some concern to shareholders to see the Colliers International Group Inc. (TSE:CIGI) share price down 11% in the last month. But that doesn't change the fact that the returns over the last five years have been pleasing. Its return of 74% has certainly bested the market return!
So let's investigate and see if the longer term performance of the company has been in line with the underlying business' progress.
See our latest analysis for Colliers International Group
In his essay The Superinvestors of Graham-and-Doddsville Warren Buffett described how share prices do not always rationally reflect the value of a business. By comparing earnings per share (EPS) and share price changes over time, we can get a feel for how investor attitudes to a company have morphed over time.
During five years of share price growth, Colliers International Group actually saw its EPS drop 12% per year.
This means it's unlikely the market is judging the company based on earnings growth. Because earnings per share don't seem to match up with the share price, we'll take a look at other metrics instead.
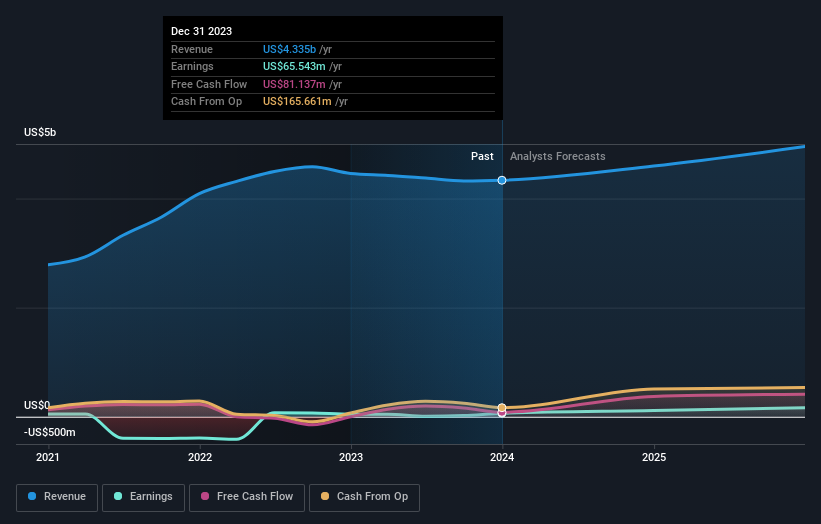
We doubt the modest 0.3% dividend yield is attracting many buyers to the stock. In contrast revenue growth of 11% per year is probably viewed as evidence that Colliers International Group is growing, a real positive. It's quite possible that management are prioritizing revenue growth over EPS growth at the moment.
The company's revenue and earnings (over time) are depicted in the image below (click to see the exact numbers).
It's good to see that there was some significant insider buying in the last three months. That's a positive. On the other hand, we think the revenue and earnings trends are much more meaningful measures of the business. If you are thinking of buying or selling Colliers International Group stock, you should check out this free report showing analyst profit forecasts.
A Different Perspective
Colliers International Group shareholders gained a total return of 4.0% during the year. Unfortunately this falls short of the market return. It's probably a good sign that the company has an even better long term track record, having provided shareholders with an annual TSR of 12% over five years. It may well be that this is a business worth popping on the watching, given the continuing positive reception, over time, from the market. I find it very interesting to look at share price over the long term as a proxy for business performance. But to truly gain insight, we need to consider other information, too. To that end, you should learn about the 3 warning signs we've spotted with Colliers International Group (including 1 which is concerning) .
If you like to buy stocks alongside management, then you might just love this free list of companies. (Hint: insiders have been buying them).
Please note, the market returns quoted in this article reflect the market weighted average returns of stocks that currently trade on Canadian exchanges.
Have feedback on this article? Concerned about the content? Get in touch with us directly. Alternatively, email editorial-team (at) simplywallst.com.
This article by Simply Wall St is general in nature. We provide commentary based on historical data and analyst forecasts only using an unbiased methodology and our articles are not intended to be financial advice. It does not constitute a recommendation to buy or sell any stock, and does not take account of your objectives, or your financial situation. We aim to bring you long-term focused analysis driven by fundamental data. Note that our analysis may not factor in the latest price-sensitive company announcements or qualitative material. Simply Wall St has no position in any stocks mentioned.
