
 Yahoo Finance
 Would CMS Energy Corporation (NYSE:CMS) Be Valuable To Income Investors?

Is CMS Energy Corporation (NYSE:CMS) a good dividend stock? How can we tell? Dividend paying companies with growing earnings can be highly rewarding in the long term. On the other hand, investors have been known to buy a stock because of its yield, and then lose money if the company's dividend doesn't live up to expectations.
While CMS Energy's 2.5% dividend yield is not the highest, we think its lengthy payment history is quite interesting. Some simple analysis can offer a lot of insights when buying a company for its dividend, and we'll go through this below.
Click the interactive chart for our full dividend analysis
Payout ratios
Dividends are typically paid from company earnings. If a company pays more in dividends than it earned, then the dividend might become unsustainable - hardly an ideal situation. So we need to form a view on if a company's dividend is sustainable, relative to its net profit after tax. Looking at the data, we can see that 69% of CMS Energy's profits were paid out as dividends in the last 12 months. A payout ratio above 50% generally implies a business is reaching maturity, although it is still possible to reinvest in the business or increase the dividend over time.
Another important check we do is to see if the free cash flow generated is sufficient to pay the dividend. Last year, CMS Energy paid a dividend while reporting negative free cash flow. While there may be an explanation, we think this behaviour is generally not sustainable.
Is CMS Energy's Balance Sheet Risky?
As CMS Energy has a meaningful amount of debt, we need to check its balance sheet to see if the company might have debt risks. A rough way to check this is with these two simple ratios: a) net debt divided by EBITDA (earnings before interest, tax, depreciation and amortisation), and b) net interest cover. Net debt to EBITDA is a measure of a company's total debt. Net interest cover measures the ability to meet interest payments. Essentially we check that a) the company does not have too much debt, and b) that it can afford to pay the interest. CMS Energy has net debt of 6.10 times its EBITDA, which implies meaningful risk if interest rates rise of earnings decline.
Net interest cover can be calculated by dividing earnings before interest and tax (EBIT) by the company's net interest expense. With EBIT of 2.51 times its interest expense, CMS Energy's interest cover is starting to look a bit thin. Low interest cover and high debt can create problems right when the investor least needs them, and we're reluctant to rely on the dividend of companies with these traits.
We update our data on CMS Energy every 24 hours, so you can always get our latest analysis of its financial health, here.
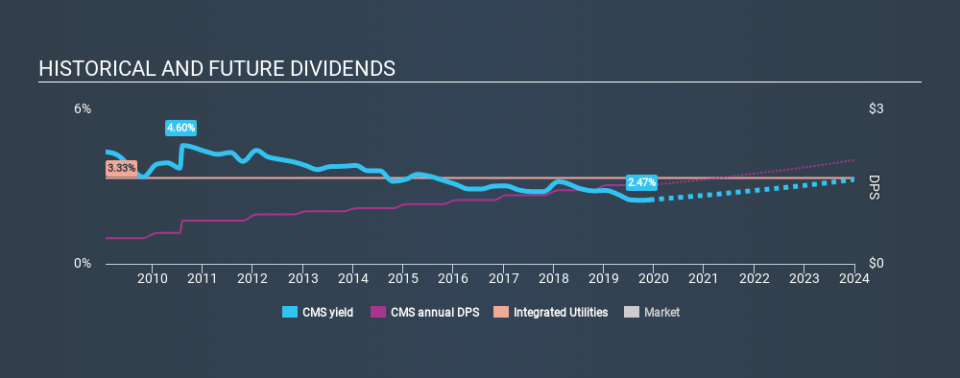
Dividend Volatility
One of the major risks of relying on dividend income, is the potential for a company to struggle financially and cut its dividend. Not only is your income cut, but the value of your investment declines as well - nasty. For the purpose of this article, we only scrutinise the last decade of CMS Energy's dividend payments. During this period the dividend has been stable, which could imply the business could have relatively consistent earnings power. During the past ten-year period, the first annual payment was US$0.50 in 2009, compared to US$1.53 last year. Dividends per share have grown at approximately 12% per year over this time.
With rapid dividend growth and no notable cuts to the dividend over a lengthy period of time, we think this company has a lot going for it.
Dividend Growth Potential
Dividend payments have been consistent over the past few years, but we should always check if earnings per share (EPS) are growing, as this will help maintain the purchasing power of the dividend. CMS Energy has grown its earnings per share at 5.1% per annum over the past five years. The rate at which earnings have grown is quite decent, and by paying out more than half of its earnings as dividends, the company is striking a reasonable balance between reinvestment and returns to shareholders.
Conclusion
To summarise, shareholders should always check that CMS Energy's dividends are affordable, that its dividend payments are relatively stable, and that it has decent prospects for growing its earnings and dividend. First, we think CMS Energy has an acceptable payout ratio, although its dividend was not well covered by cashflow. Second, earnings growth has been mediocre, but at least the dividends have been relatively stable. In sum, we find it hard to get excited about CMS Energy from a dividend perspective. It's not that we think it's a bad business; just that there are other companies that perform better on these criteria.
Earnings growth generally bodes well for the future value of company dividend payments. See if the 13 CMS Energy analysts we track are forecasting continued growth with our free report on analyst estimates for the company.
We have also put together a list of global stocks with a market capitalisation above $1bn and yielding more 3%.
If you spot an error that warrants correction, please contact the editor at editorial-team@simplywallst.com. This article by Simply Wall St is general in nature. It does not constitute a recommendation to buy or sell any stock, and does not take account of your objectives, or your financial situation. Simply Wall St has no position in the stocks mentioned.
We aim to bring you long-term focused research analysis driven by fundamental data. Note that our analysis may not factor in the latest price-sensitive company announcements or qualitative material. Thank you for reading.
