
 Yahoo Finance
 A Close Look At Seven Generations Energy Ltd.’s (TSE:VII) 13% ROCE

Today we'll look at Seven Generations Energy Ltd. (TSE:VII) and reflect on its potential as an investment. To be precise, we'll consider its Return On Capital Employed (ROCE), as that will inform our view of the quality of the business.
First of all, we'll work out how to calculate ROCE. Second, we'll look at its ROCE compared to similar companies. And finally, we'll look at how its current liabilities are impacting its ROCE.
Understanding Return On Capital Employed (ROCE)
ROCE measures the 'return' (pre-tax profit) a company generates from capital employed in its business. Generally speaking a higher ROCE is better. Overall, it is a valuable metric that has its flaws. Renowned investment researcher Michael Mauboussin has suggested that a high ROCE can indicate that 'one dollar invested in the company generates value of more than one dollar'.
So, How Do We Calculate ROCE?
Analysts use this formula to calculate return on capital employed:
Return on Capital Employed = Earnings Before Interest and Tax (EBIT) ÷ (Total Assets - Current Liabilities)
Or for Seven Generations Energy:
0.13 = CA$1.0b ÷ (CA$8.3b - CA$420m) (Based on the trailing twelve months to June 2019.)
Therefore, Seven Generations Energy has an ROCE of 13%.
View our latest analysis for Seven Generations Energy
Does Seven Generations Energy Have A Good ROCE?
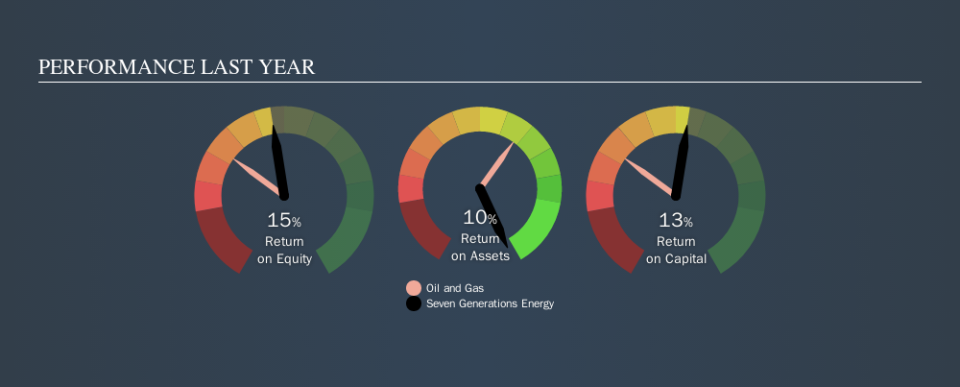
ROCE is commonly used for comparing the performance of similar businesses. In our analysis, Seven Generations Energy's ROCE is meaningfully higher than the 5.6% average in the Oil and Gas industry. I think that's good to see, since it implies the company is better than other companies at making the most of its capital. Independently of how Seven Generations Energy compares to its industry, its ROCE in absolute terms appears decent, and the company may be worthy of closer investigation.
Our data shows that Seven Generations Energy currently has an ROCE of 13%, compared to its ROCE of 5.6% 3 years ago. This makes us wonder if the company is improving. The image below shows how Seven Generations Energy's ROCE compares to its industry, and you can click it to see more detail on its past growth.
When considering this metric, keep in mind that it is backwards looking, and not necessarily predictive. ROCE can be misleading for companies in cyclical industries, with returns looking impressive during the boom times, but very weak during the busts. ROCE is, after all, simply a snap shot of a single year. Remember that most companies like Seven Generations Energy are cyclical businesses. What happens in the future is pretty important for investors, so we have prepared a free report on analyst forecasts for Seven Generations Energy.
What Are Current Liabilities, And How Do They Affect Seven Generations Energy's ROCE?
Short term (or current) liabilities, are things like supplier invoices, overdrafts, or tax bills that need to be paid within 12 months. The ROCE equation subtracts current liabilities from capital employed, so a company with a lot of current liabilities appears to have less capital employed, and a higher ROCE than otherwise. To counteract this, we check if a company has high current liabilities, relative to its total assets.
Seven Generations Energy has total assets of CA$8.3b and current liabilities of CA$420m. Therefore its current liabilities are equivalent to approximately 5.0% of its total assets. In addition to low current liabilities (making a negligible impact on ROCE), Seven Generations Energy earns a sound return on capital employed.
What We Can Learn From Seven Generations Energy's ROCE
This is good to see, and while better prospects may exist, Seven Generations Energy seems worth researching further. There might be better investments than Seven Generations Energy out there, but you will have to work hard to find them . These promising businesses with rapidly growing earnings might be right up your alley.
If you like to buy stocks alongside management, then you might just love this free list of companies. (Hint: insiders have been buying them).
We aim to bring you long-term focused research analysis driven by fundamental data. Note that our analysis may not factor in the latest price-sensitive company announcements or qualitative material.
If you spot an error that warrants correction, please contact the editor at editorial-team@simplywallst.com. This article by Simply Wall St is general in nature. It does not constitute a recommendation to buy or sell any stock, and does not take account of your objectives, or your financial situation. Simply Wall St has no position in the stocks mentioned. Thank you for reading.
