
 Yahoo Finance
 A Close Look At Good Energy Group PLC’s (LON:GOOD) 9.3% ROCE

Want to participate in a short research study? Help shape the future of investing tools and you could win a $250 gift card!
Today we'll evaluate Good Energy Group PLC (LON:GOOD) to determine whether it could have potential as an investment idea. Specifically, we're going to calculate its Return On Capital Employed (ROCE), in the hopes of getting some insight into the business.
First, we'll go over how we calculate ROCE. Next, we'll compare it to others in its industry. Then we'll determine how its current liabilities are affecting its ROCE.
Understanding Return On Capital Employed (ROCE)
ROCE is a metric for evaluating how much pre-tax income (in percentage terms) a company earns on the capital invested in its business. Generally speaking a higher ROCE is better. Ultimately, it is a useful but imperfect metric. Renowned investment researcher Michael Mauboussin has suggested that a high ROCE can indicate that 'one dollar invested in the company generates value of more than one dollar'.
How Do You Calculate Return On Capital Employed?
The formula for calculating the return on capital employed is:
Return on Capital Employed = Earnings Before Interest and Tax (EBIT) ÷ (Total Assets - Current Liabilities)
Or for Good Energy Group:
0.093 = UK£7.0m ÷ (UK£119m - UK£43m) (Based on the trailing twelve months to December 2018.)
Therefore, Good Energy Group has an ROCE of 9.3%.
See our latest analysis for Good Energy Group
Does Good Energy Group Have A Good ROCE?
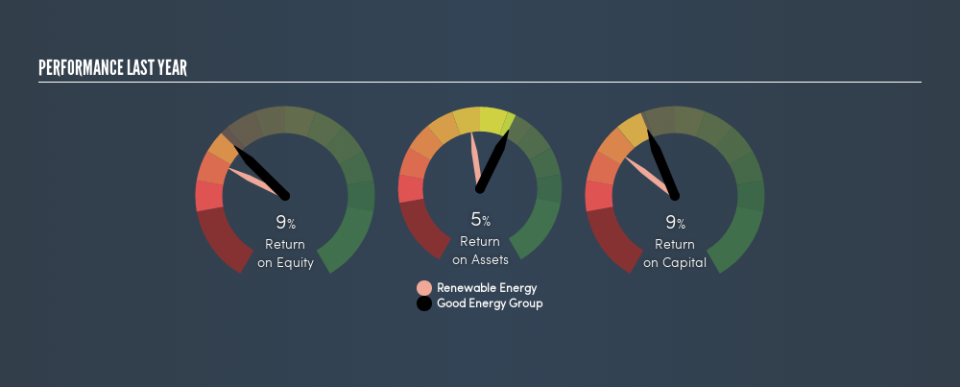
ROCE can be useful when making comparisons, such as between similar companies. Using our data, we find that Good Energy Group's ROCE is meaningfully better than the 5.4% average in the Renewable Energy industry. We consider this a positive sign, because it suggests it uses capital more efficiently than similar companies. Separate from Good Energy Group's performance relative to its industry, its ROCE in absolute terms looks satisfactory, and it may be worth researching in more depth.
We can see that , Good Energy Group currently has an ROCE of 9.3% compared to its ROCE 3 years ago, which was 5.8%. This makes us wonder if the company is improving. You can see in the image below how Good Energy Group's ROCE compares to its industry. Click to see more on past growth.
Remember that this metric is backwards looking - it shows what has happened in the past, and does not accurately predict the future. Companies in cyclical industries can be difficult to understand using ROCE, as returns typically look high during boom times, and low during busts. ROCE is only a point-in-time measure. Future performance is what matters, and you can see analyst predictions in our free report on analyst forecasts for the company.
Do Good Energy Group's Current Liabilities Skew Its ROCE?
Short term (or current) liabilities, are things like supplier invoices, overdrafts, or tax bills that need to be paid within 12 months. Due to the way the ROCE equation works, having large bills due in the near term can make it look as though a company has less capital employed, and thus a higher ROCE than usual. To counteract this, we check if a company has high current liabilities, relative to its total assets.
Good Energy Group has total assets of UK£119m and current liabilities of UK£43m. As a result, its current liabilities are equal to approximately 36% of its total assets. With this level of current liabilities, Good Energy Group's ROCE is boosted somewhat.
Our Take On Good Energy Group's ROCE
While its ROCE looks good, it's worth remembering that the current liabilities are making the business look better. There might be better investments than Good Energy Group out there, but you will have to work hard to find them . These promising businesses with rapidly growing earnings might be right up your alley.
If you are like me, then you will not want to miss this free list of growing companies that insiders are buying.
We aim to bring you long-term focused research analysis driven by fundamental data. Note that our analysis may not factor in the latest price-sensitive company announcements or qualitative material.
If you spot an error that warrants correction, please contact the editor at editorial-team@simplywallst.com. This article by Simply Wall St is general in nature. It does not constitute a recommendation to buy or sell any stock, and does not take account of your objectives, or your financial situation. Simply Wall St has no position in the stocks mentioned. Thank you for reading.
