
 Yahoo Finance
 Close Brothers Group (LON:CBG) Is Increasing Its Dividend To £0.44
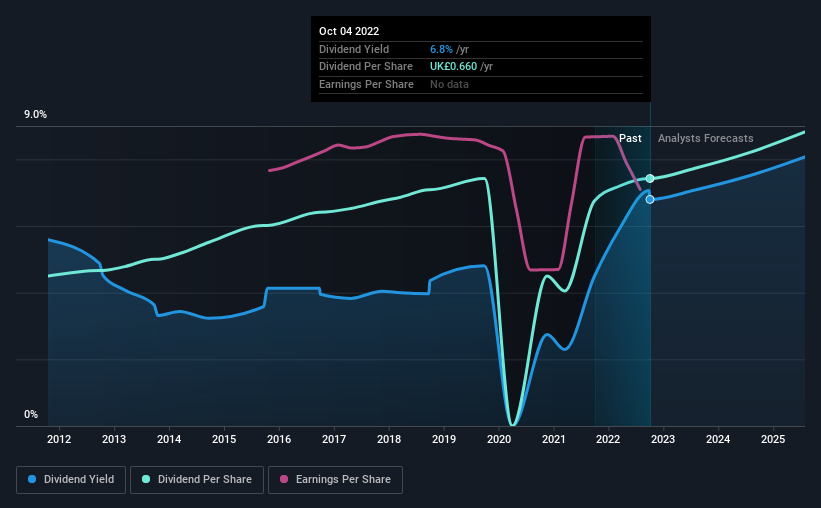
The board of Close Brothers Group plc (LON:CBG) has announced that it will be paying its dividend of £0.44 on the 22nd of November, an increased payment from last year's comparable dividend. This makes the dividend yield 6.8%, which is above the industry average.
See our latest analysis for Close Brothers Group
Close Brothers Group's Earnings Will Easily Cover The Distributions
Impressive dividend yields are good, but this doesn't matter much if the payments can't be sustained.
Close Brothers Group has established itself as a dividend paying company with over 10 years history of distributing earnings to shareholders. Taking data from its last earnings report, calculating for the company's payout ratio shows 60%, which means that Close Brothers Group would be able to pay its last dividend without pressure on the balance sheet.
Over the next 3 years, EPS is forecast to expand by 34.4%. Analysts forecast the future payout ratio could be 53% over the same time horizon, which is a number we think the company can maintain.
Dividend Volatility
Although the company has a long dividend history, it has been cut at least once in the last 10 years. Since 2012, the dividend has gone from £0.40 total annually to £0.66. This implies that the company grew its distributions at a yearly rate of about 5.1% over that duration. A reasonable rate of dividend growth is good to see, but we're wary that the dividend history is not as solid as we'd like, having been cut at least once.
Dividend Growth May Be Hard To Achieve
With a relatively unstable dividend, it's even more important to evaluate if earnings per share is growing, which could point to a growing dividend in the future. It's not great to see that Close Brothers Group's earnings per share has fallen at approximately 3.2% per year over the past five years. Declining earnings will inevitably lead to the company paying a lower dividend in line with lower profits. Earnings are forecast to grow over the next 12 months and if that happens we could still be a little bit cautious until it becomes a pattern.
In Summary
Overall, this is probably not a great income stock, even though the dividend is being raised at the moment. The company hasn't been paying a very consistent dividend over time, despite only paying out a small portion of earnings. This company is not in the top tier of income providing stocks.
It's important to note that companies having a consistent dividend policy will generate greater investor confidence than those having an erratic one. Meanwhile, despite the importance of dividend payments, they are not the only factors our readers should know when assessing a company. As an example, we've identified 1 warning sign for Close Brothers Group that you should be aware of before investing. Looking for more high-yielding dividend ideas? Try our collection of strong dividend payers.
Have feedback on this article? Concerned about the content? Get in touch with us directly. Alternatively, email editorial-team (at) simplywallst.com.
This article by Simply Wall St is general in nature. We provide commentary based on historical data and analyst forecasts only using an unbiased methodology and our articles are not intended to be financial advice. It does not constitute a recommendation to buy or sell any stock, and does not take account of your objectives, or your financial situation. We aim to bring you long-term focused analysis driven by fundamental data. Note that our analysis may not factor in the latest price-sensitive company announcements or qualitative material. Simply Wall St has no position in any stocks mentioned.
Join A Paid User Research Session
You’ll receive a US$30 Amazon Gift card for 1 hour of your time while helping us build better investing tools for the individual investors like yourself. Sign up here
